Questions
- What are Dot Plots?
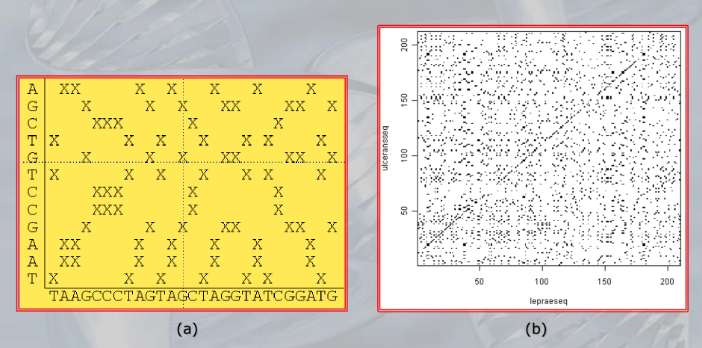
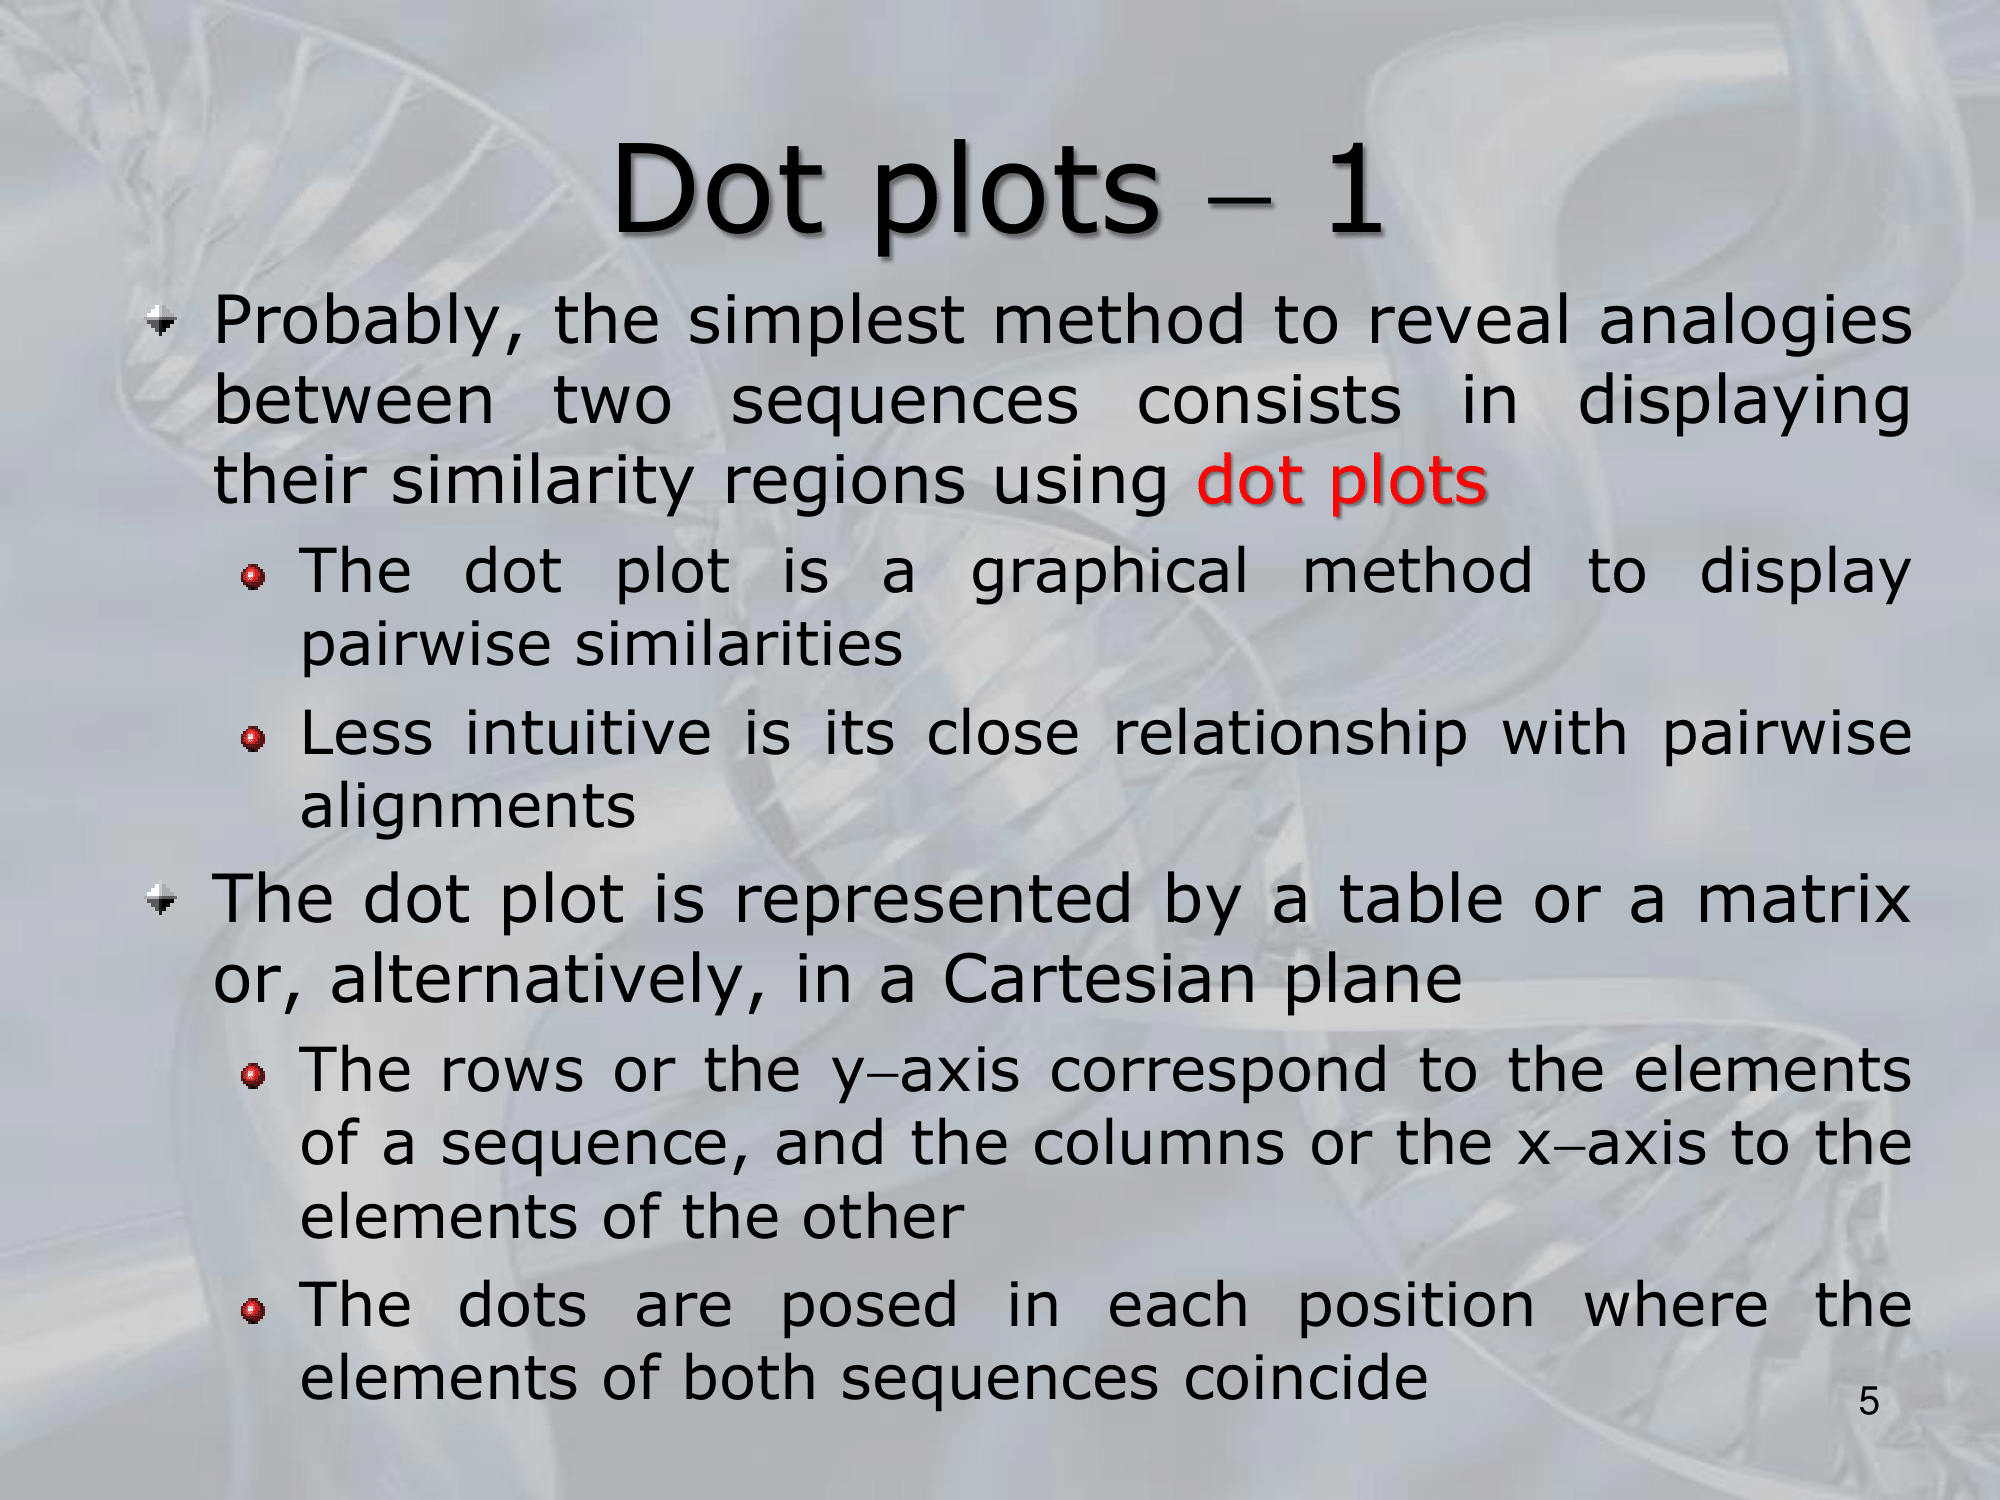
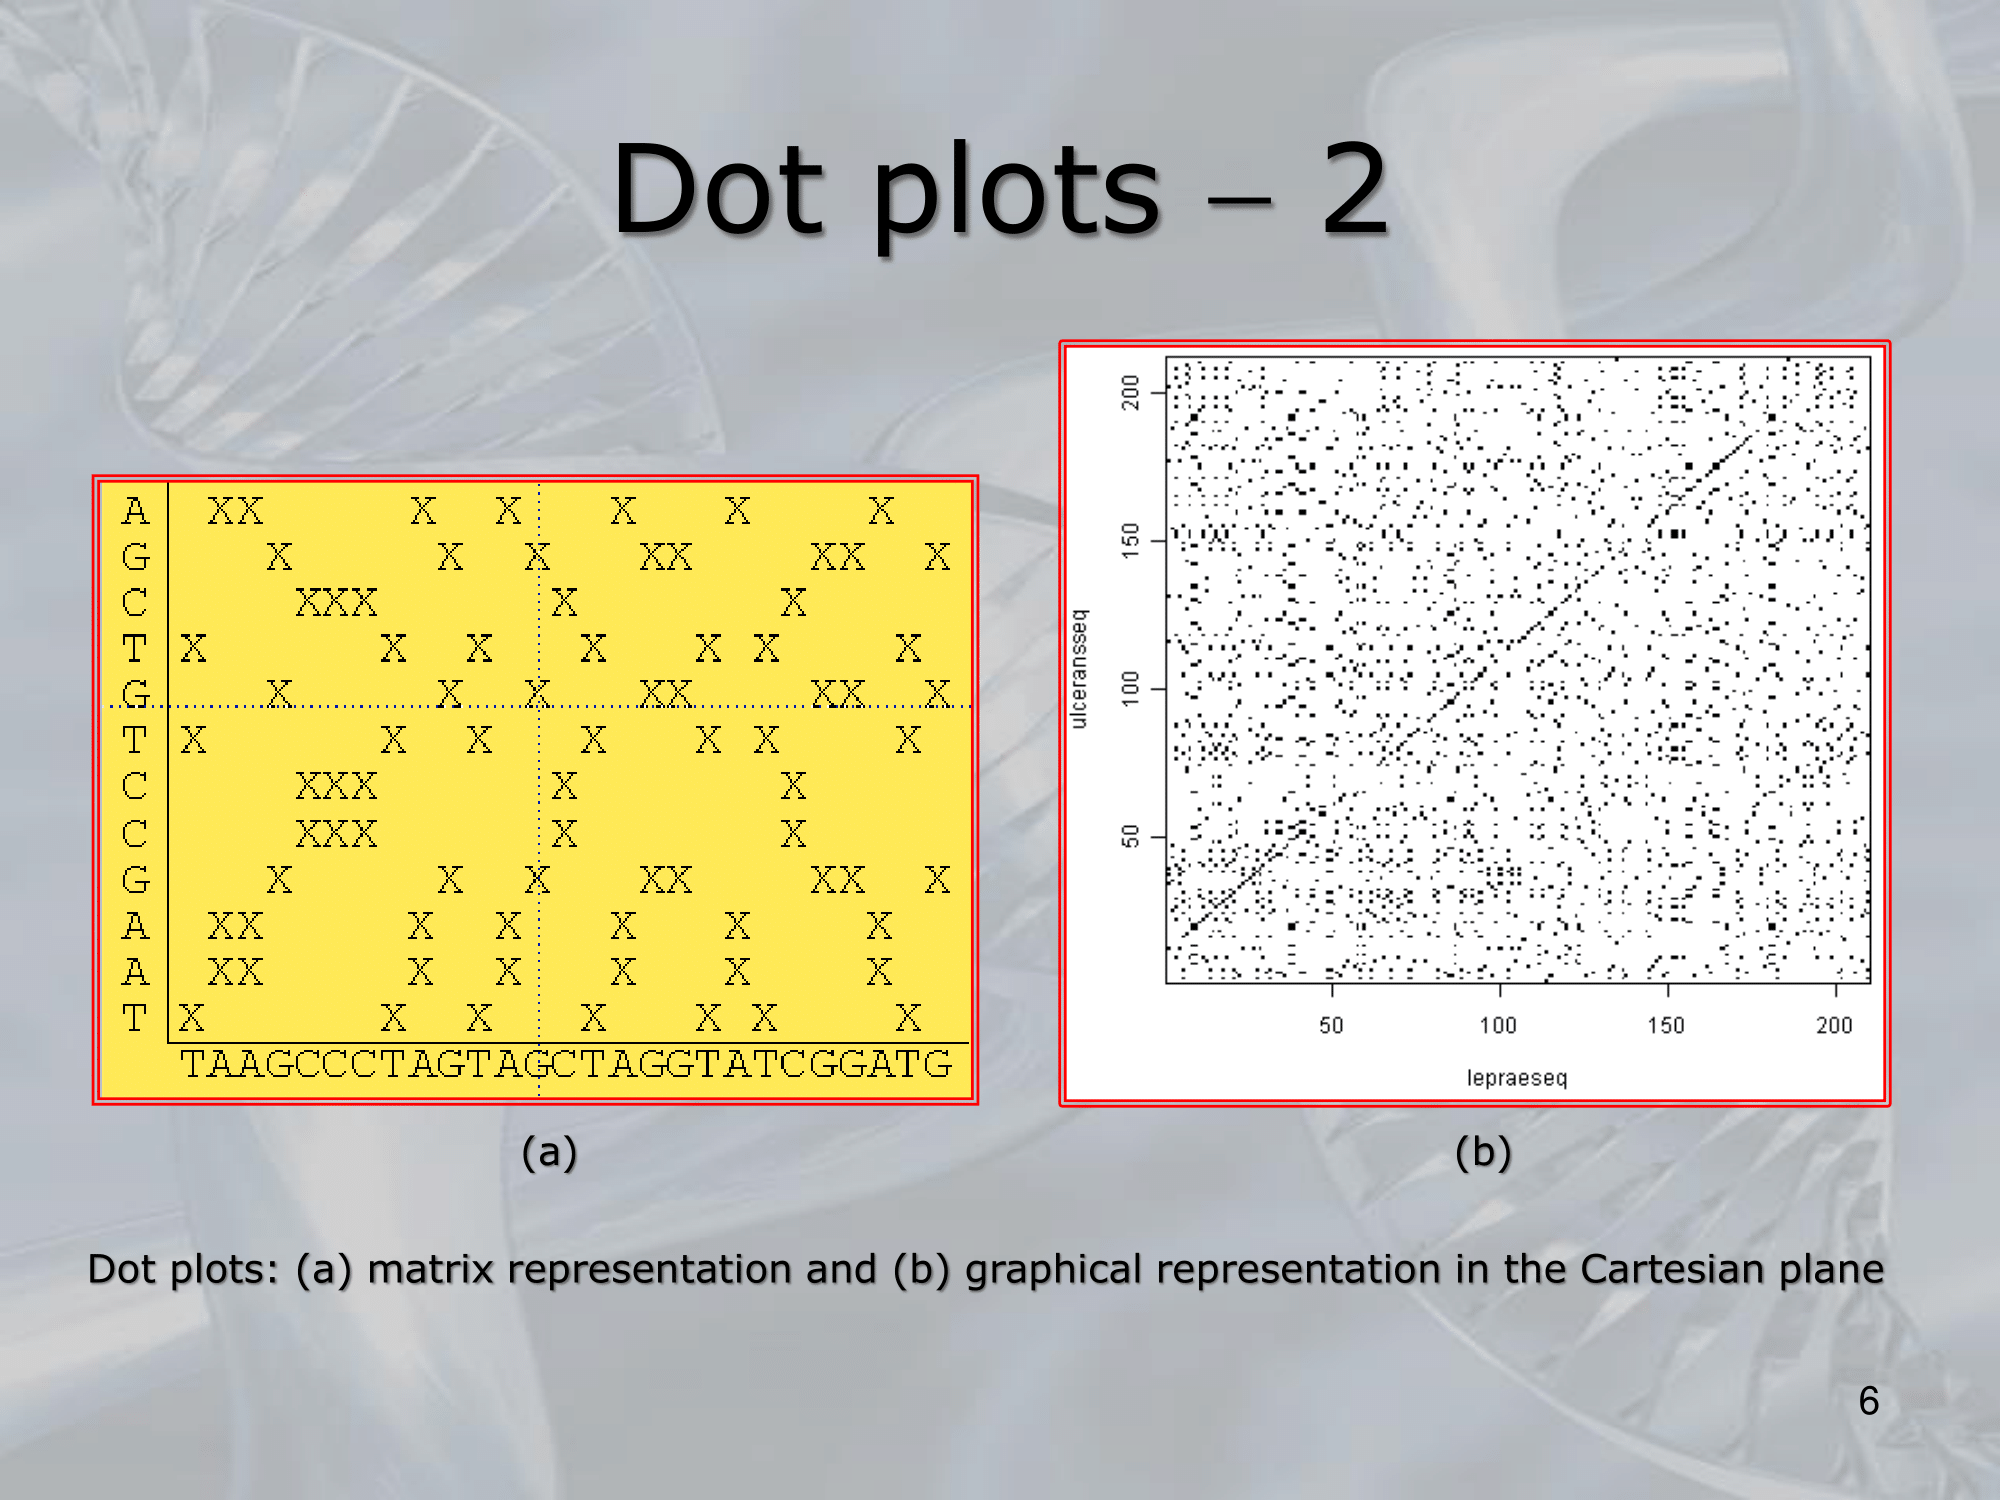
- ==A dot plot is a graphical representation of the similarity between two sequences. In a dot plot, one sequence is plotted along the x-axis, and the other sequence is plotted along the y-axis.
A dot is placed at each position where the nucleotides or amino acids in the two sequences match==. - Dot plots are useful for visualizing the degree of similarity between two sequences, especially when there are regions of similarity that are not easy to detect using other methods.
Dot plots can also be used to identify repeating patterns or motifs within a sequence. - To create a dot plot, the two sequences are aligned using a pairwise alignment algorithm, such as the Needleman-Wunsch or Smith-Waterman algorithm.
Then, for each pair of aligned positions, a dot is placed in the corresponding position in the plot if the nucleotides or amino acids match. - Dot plots can be created manually using a graph paper or using computer software, such as BioEdit or Dotlet.
Dot plots are particularly useful for comparing smaller sequences, such as promoter regions or small genes, and can provide a visual representation of sequence similarity that can be easily interpreted.
- ==A dot plot is a graphical representation of the similarity between two sequences. In a dot plot, one sequence is plotted along the x-axis, and the other sequence is plotted along the y-axis.
- Can you make an Example of a Dot Plot?
- Let’s say we have two DNA sequences:
- Sequence 1: ATCGCTAGGGCACGACT
- Sequence 2: ATCGCTACGGCACGACT
- To create a dot plot of these two sequences, we first align them using a pairwise alignment algorithm.
Here’s the alignment:- Sequence 1: ATCGCTAGGGCACGACT
- Sequence 2: ATCGCTA-CGGCACGACT
- We can then create a dot plot by plotting each matching position as a dot.
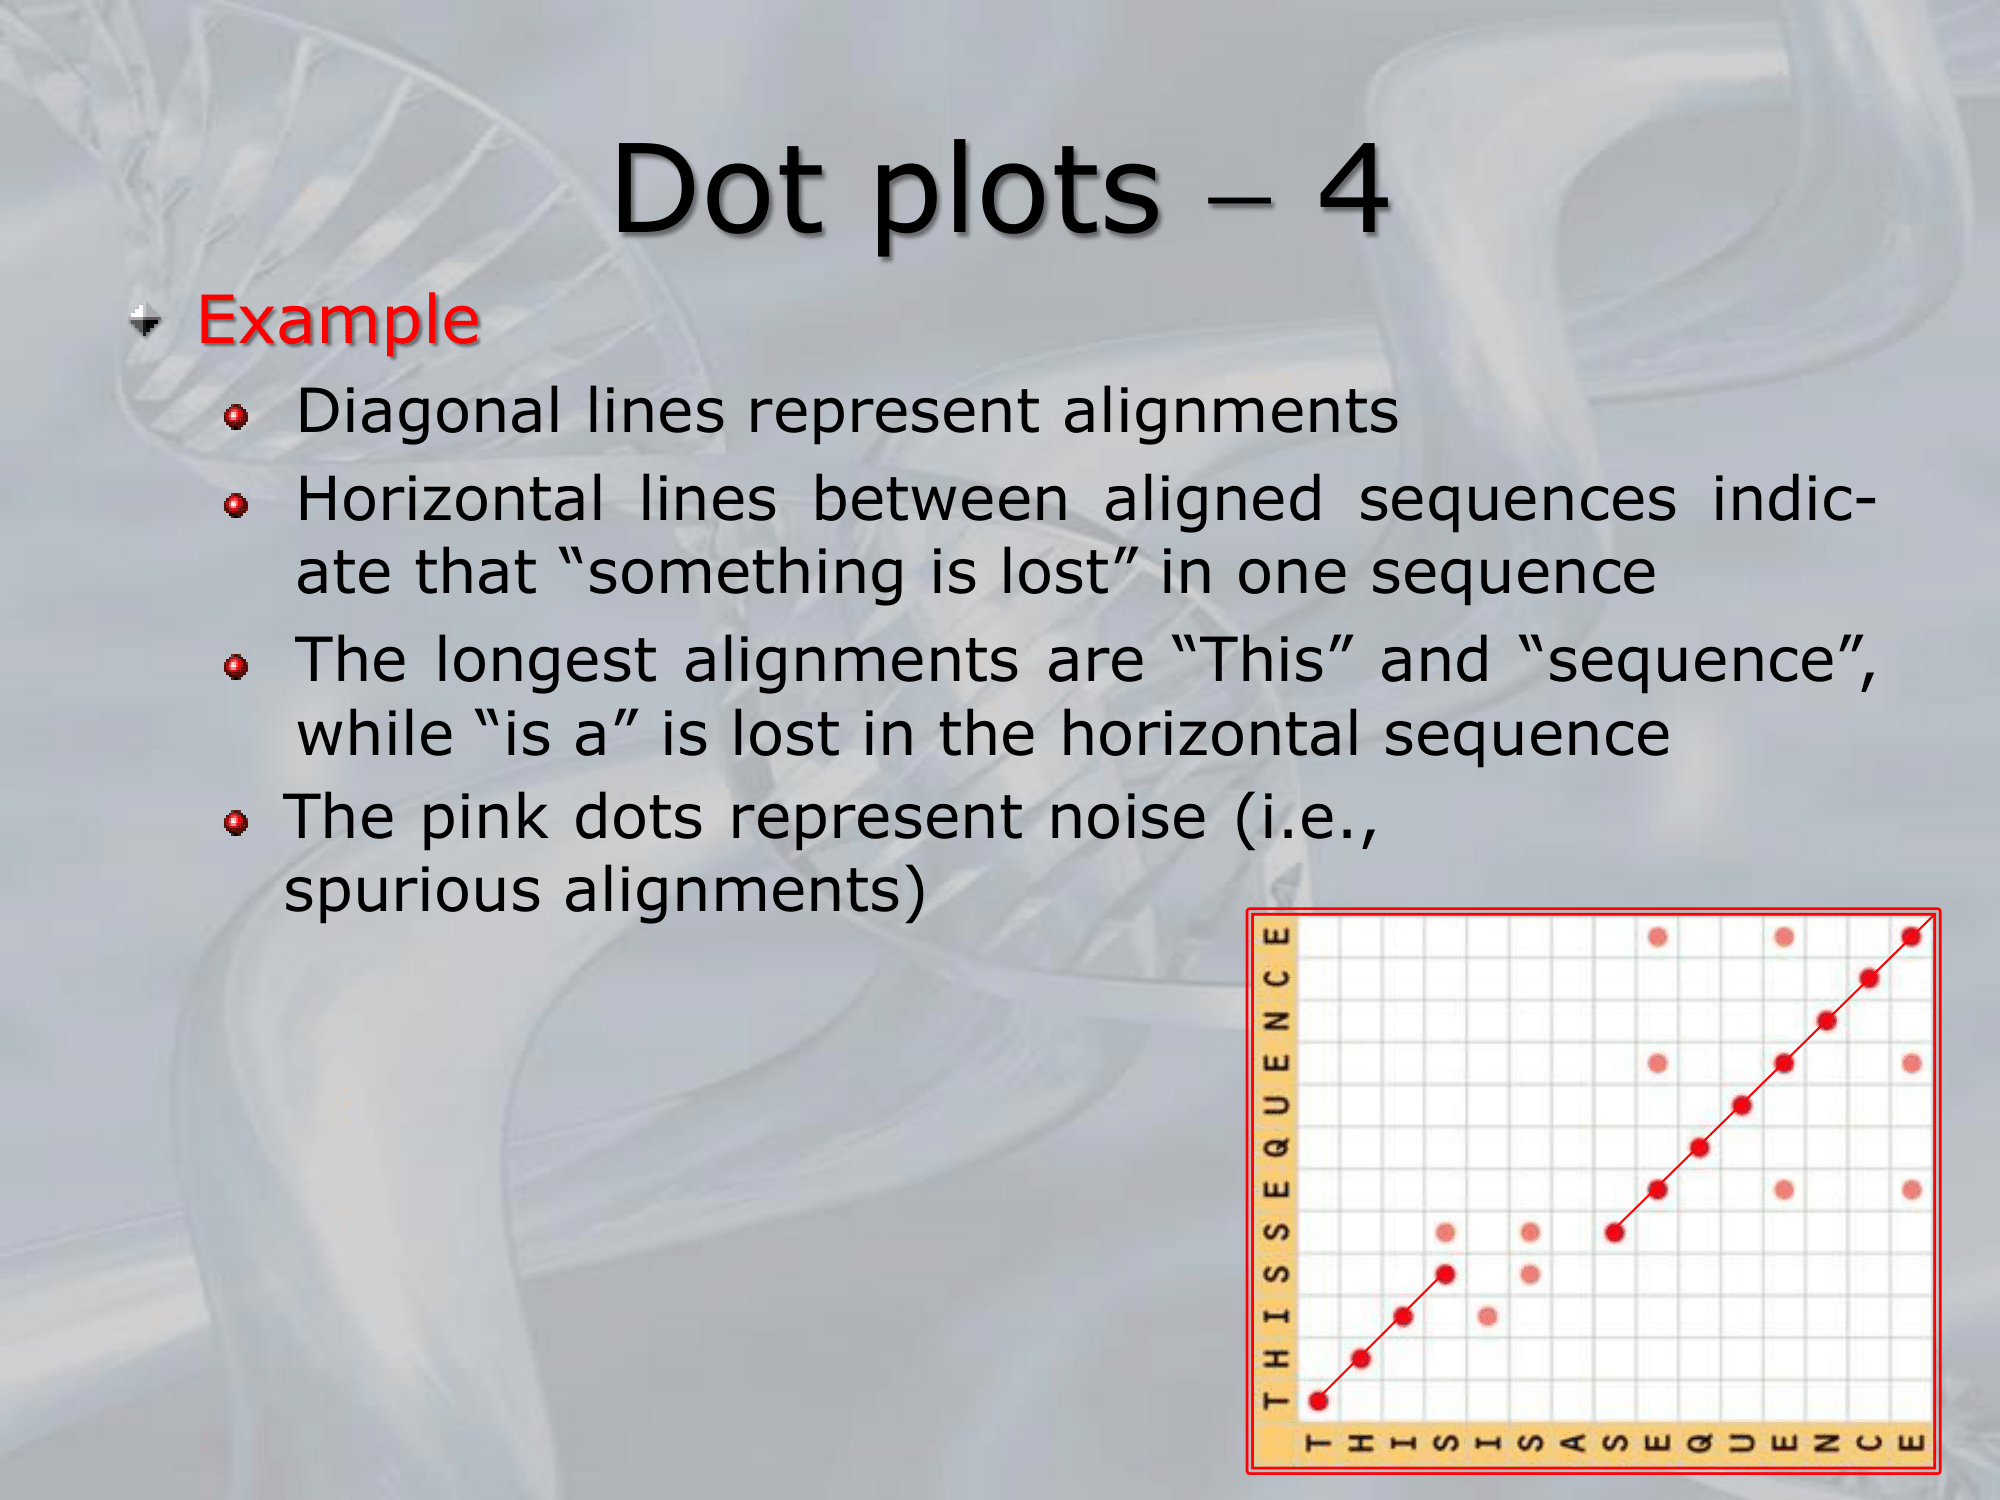
Here’s what the dot plot would look like:A T C G C T A G G G C A C G A C T __________________________________ A| . . . . T| . . . C| . . . . . G| . . . . . C| . . . . . T| . . . A| . . . . C| . . . . . G| . . . . . G| . . . . . C| . . . . . A| . . . . C| . . . . . G| . . . . . C| . . . . . A| . . . . T| . . .
- Let’s say we have two DNA sequences:
—————————————————————
IMPORTANTE
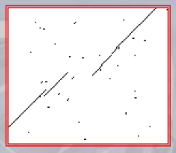
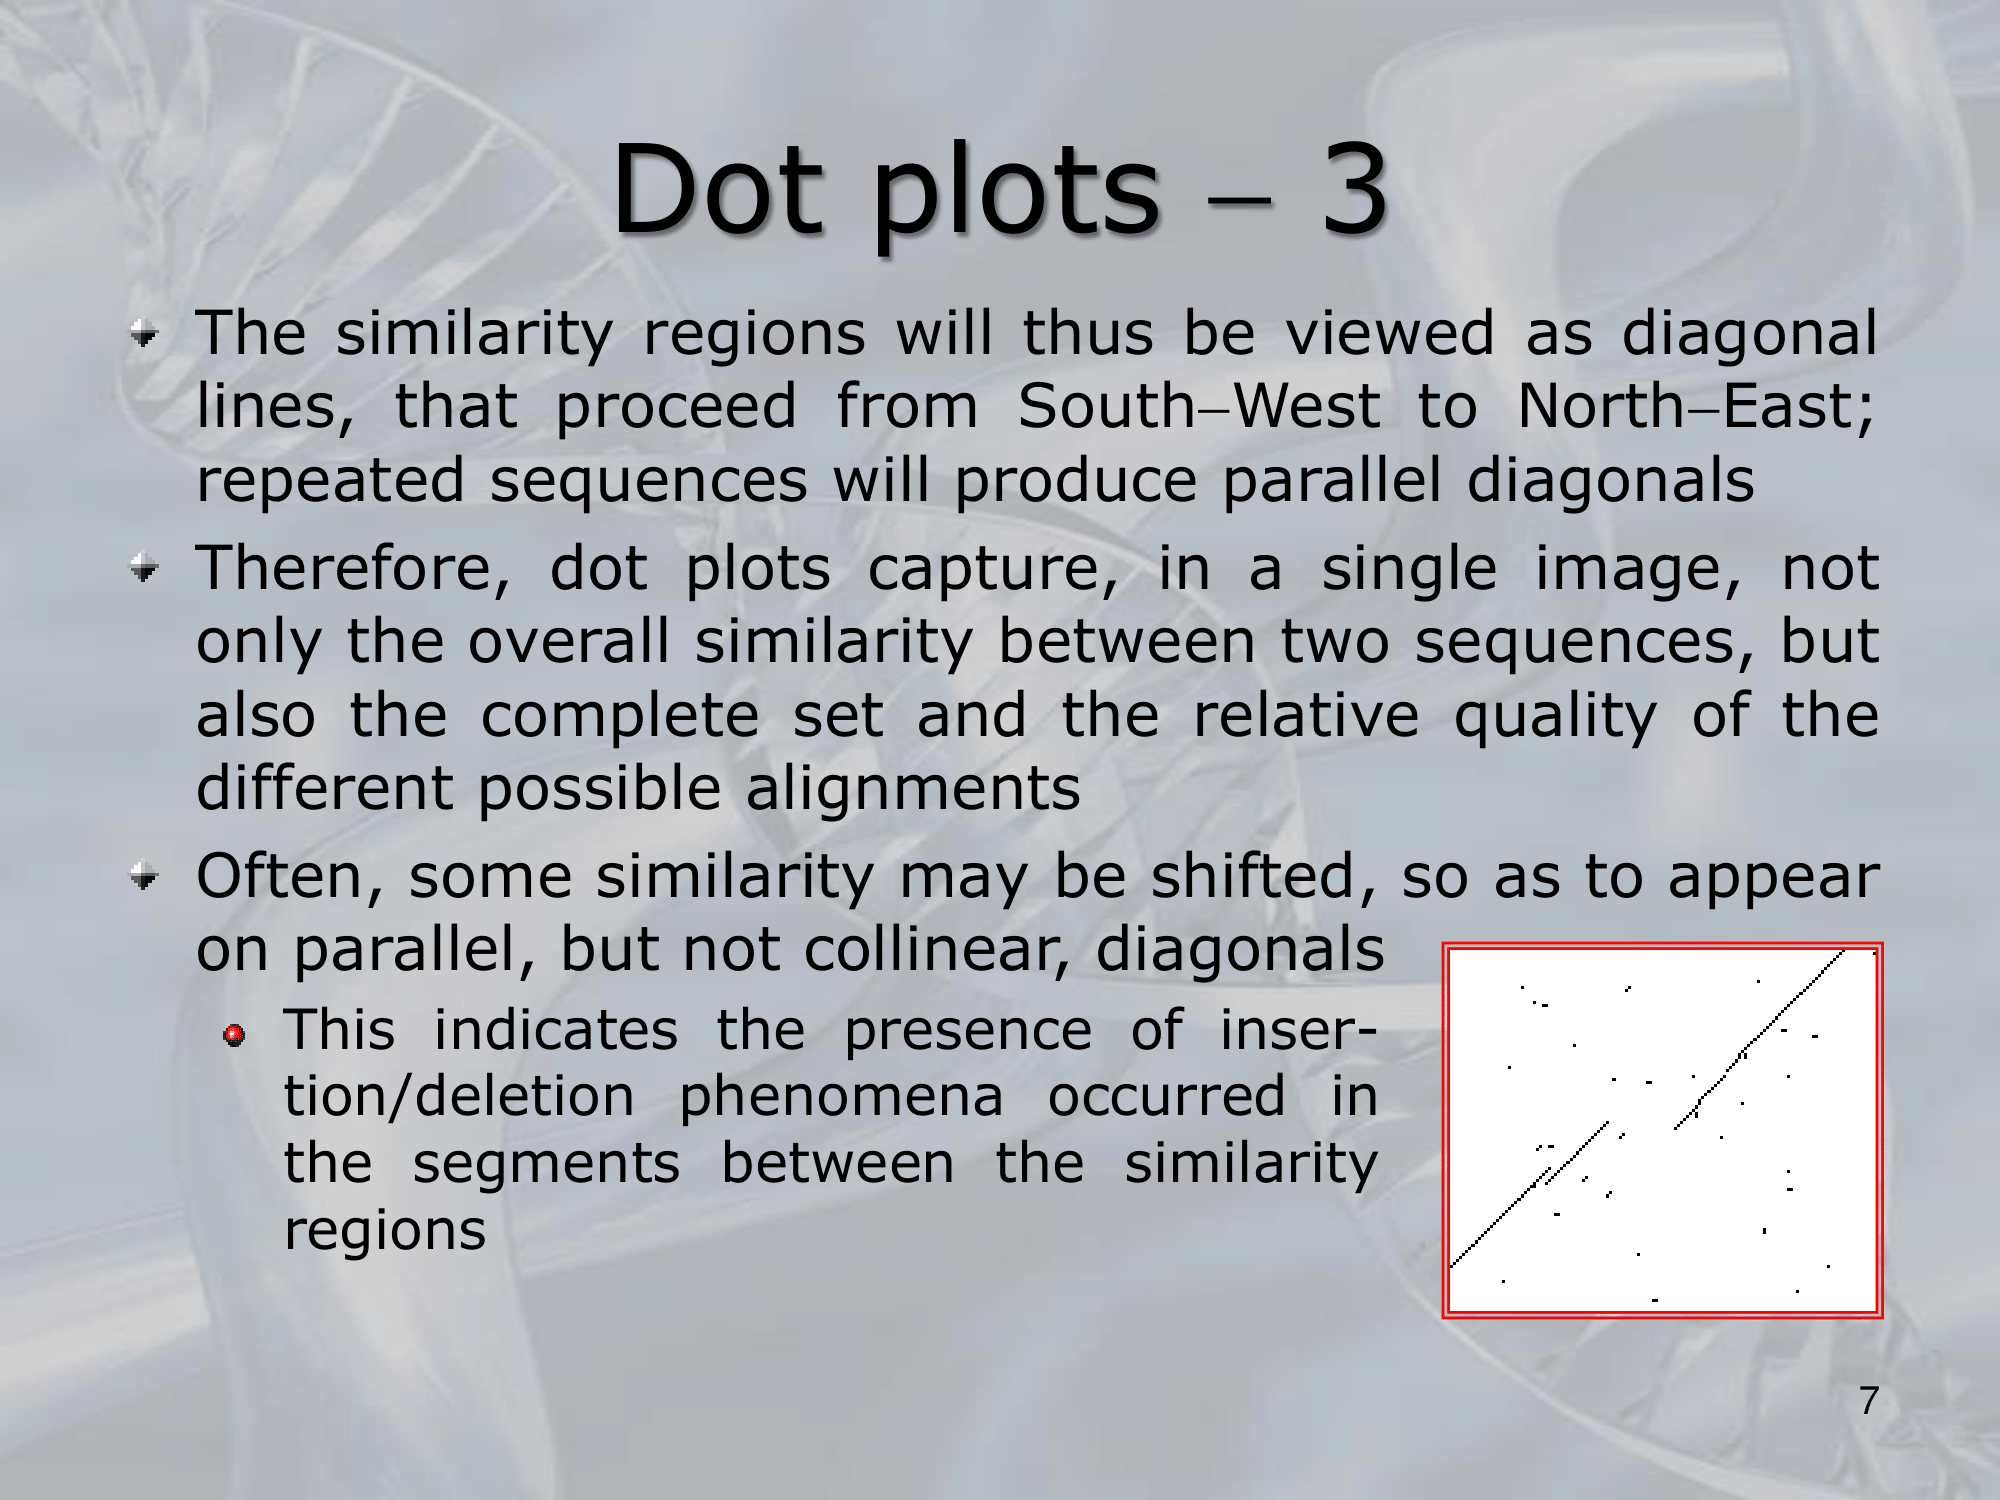
IMPORTANTE I “Dot Plots”, consistono in segnare con un punto su un piano cartesiano dove due sequenze hanno la stessa base, facendo così verrà fuori un grafico dove appariranno delle linee diagonali, incomplete e/o shiftate.
La presenza di linee diagonali, indicherà una probabile correlazione tra le due sequenze, mentre uno shift tra più linee diagonali indicherà un possibile fenomeno di inserzione/cancellazione che è avvenuto durante l’evoluzione delle due sequenze.
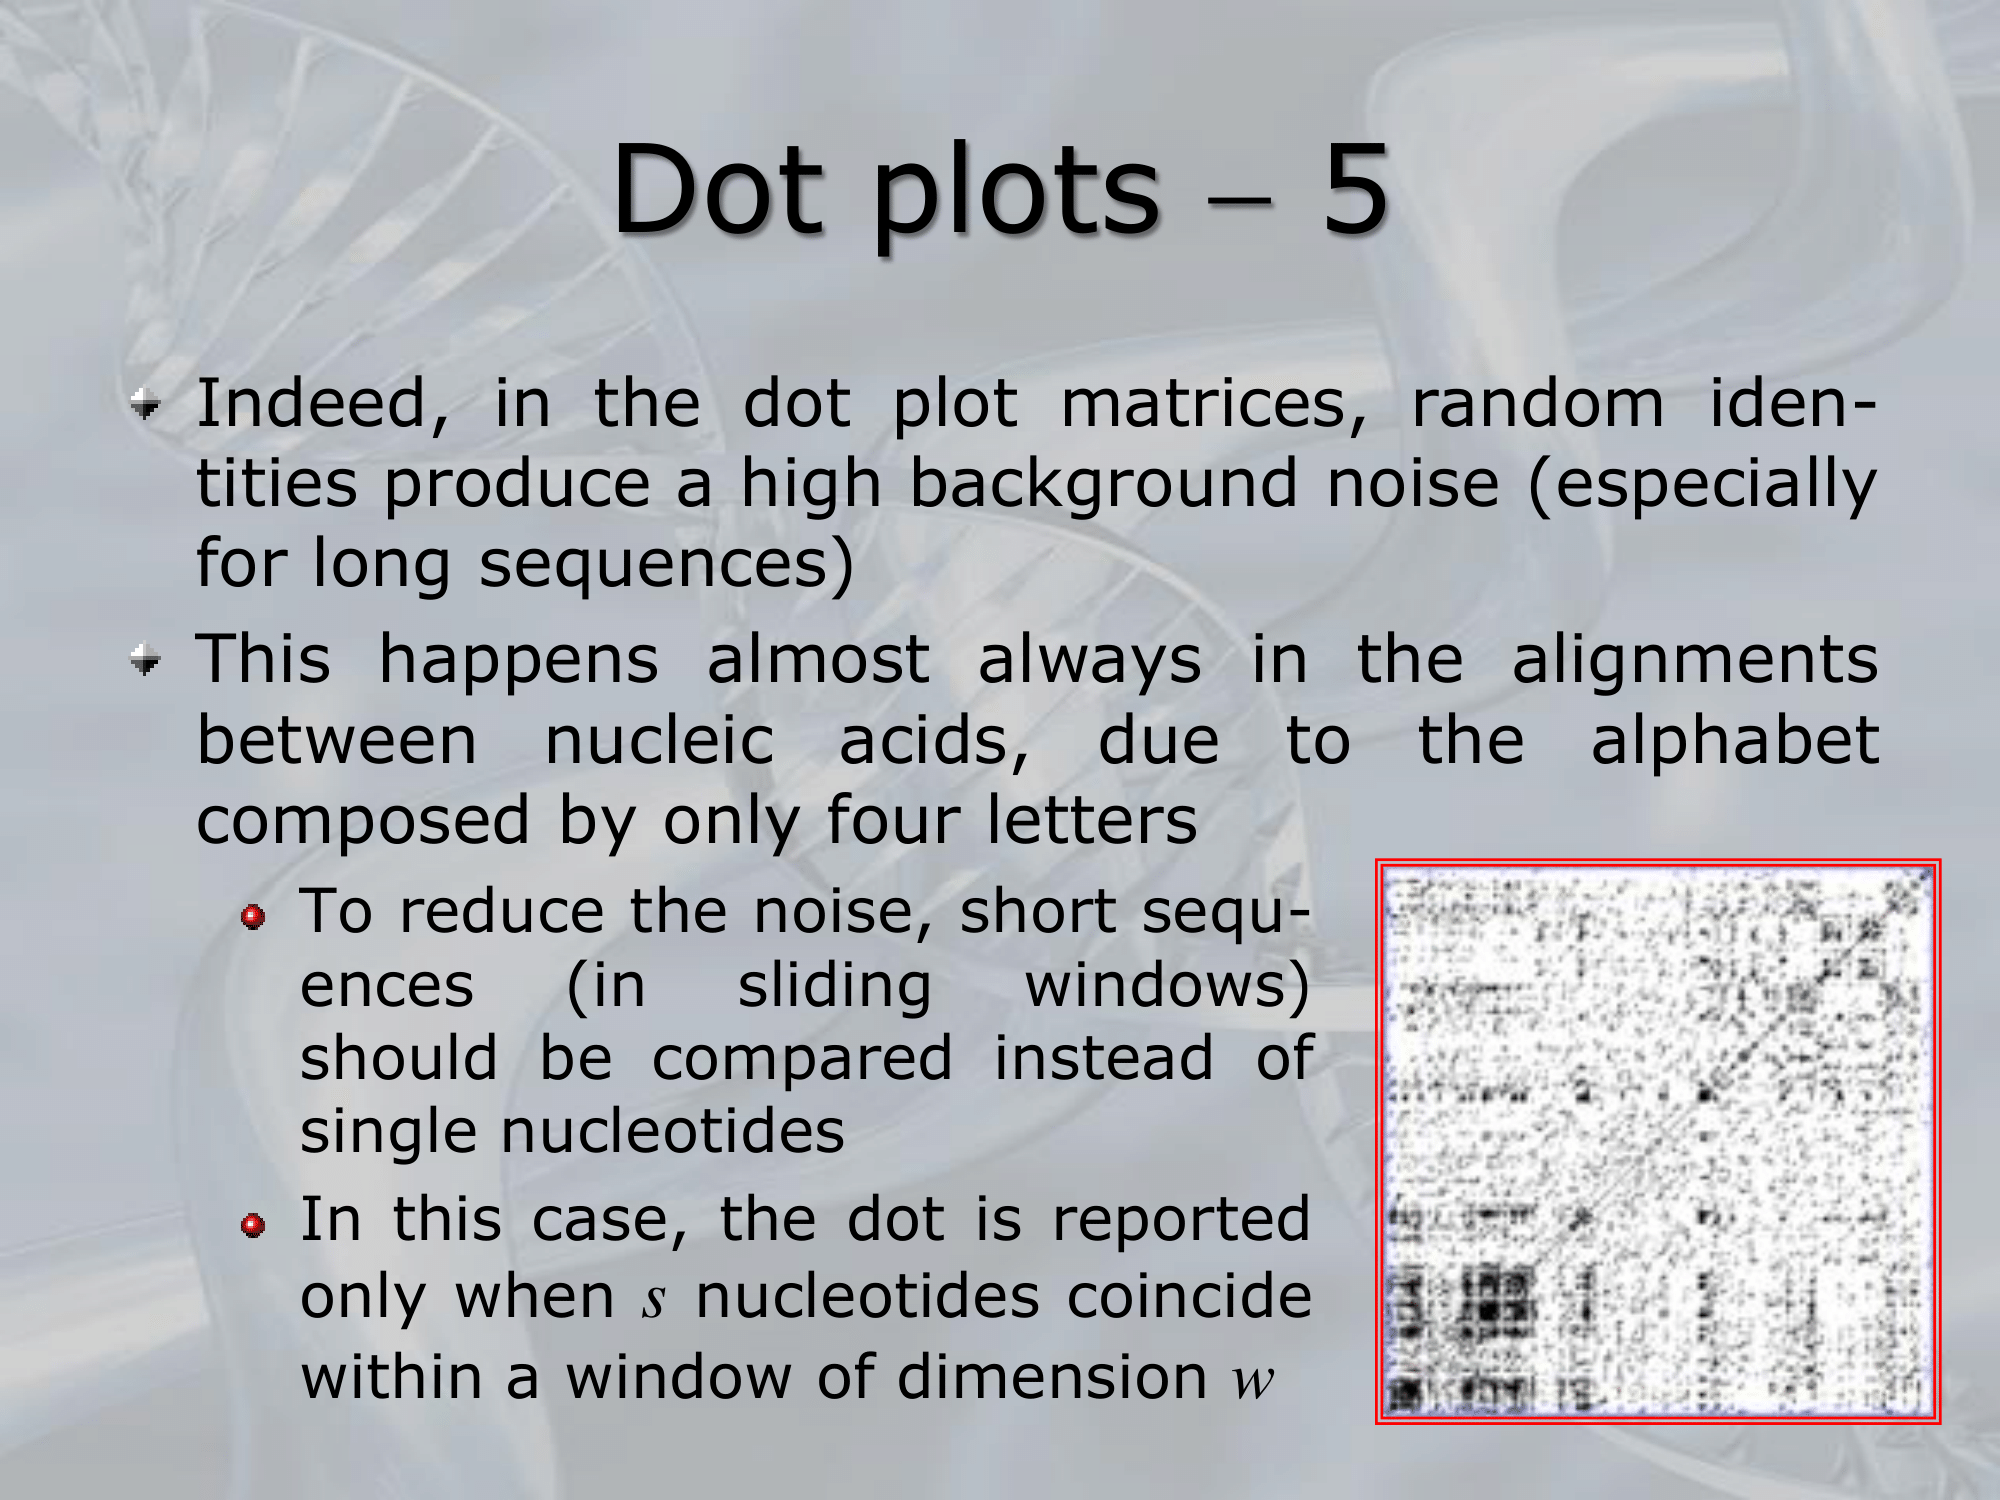
Un modo per ridurre il “rumore di sottofondo” nei dot plot è quello di usare un algortimo sliding window e considerare solo linee diagonali aventi un lunghezza in una finestra di dimensione .
Nel caso di sequenze di amminoacidi, che verranno poi tradotte in proteine, i dot plot non sono molto utili, in quanto considerano solo le basi identiche tra loro, mentre in molti casi due “quasi identiche” proteine, ovvero in questo caso intendo due proteine che hanno catena amminoacidica molto simile, e differenziano anche solo in una base, possono avere ruoli completamente diversi in un organismo.
—————————————————————
Slides with Notes
IMPORTANTE I “Dot Plots”, consistono in segnare con un punto su un piano cartesiano dove due sequenze hanno la stessa base, facendo così verrà fuori un grafico dove appariranno delle linee diagonali, incomplete e/o shiftate.
La presenza di linee diagonali, indicherà una probabile correlazione tra le due sequenze, mentre uno shift tra più linee diagonali indicherà un possibile fenomeno di inserzione/cancellazione che è avvenuto durante l’evoluzione delle due sequenze.
Un modo per ridurre il “rumore di sottofondo” nei dot plot è quello di usare un algortimo sliding window e considerare solo linee diagonali aventi un lunghezza in una finestra di dimensione .
Nel caso di sequenze di amminoacidi, che verranno poi tradotte in proteine, i dot plot non sono molto utili, in quanto considerano solo le basi identiche tra loro, mentre in molti casi due “quasi identiche” proteine, ovvero in questo caso intendo due proteine che hanno catena amminoacidica molto simile, e differenziano anche solo in una base, possono avere ruoli completamente diversi in un organismo.