Remeber:
- Apllying a current to a passive sensor (or even applying a current/voltage in general) will result in heat-dispersion, so if the temperature of the sensor is a relavant factor for determening the measure of the target, self-heating can be a problem.
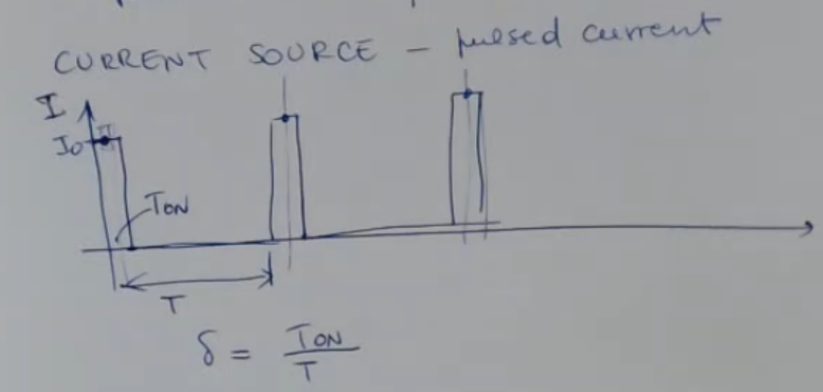
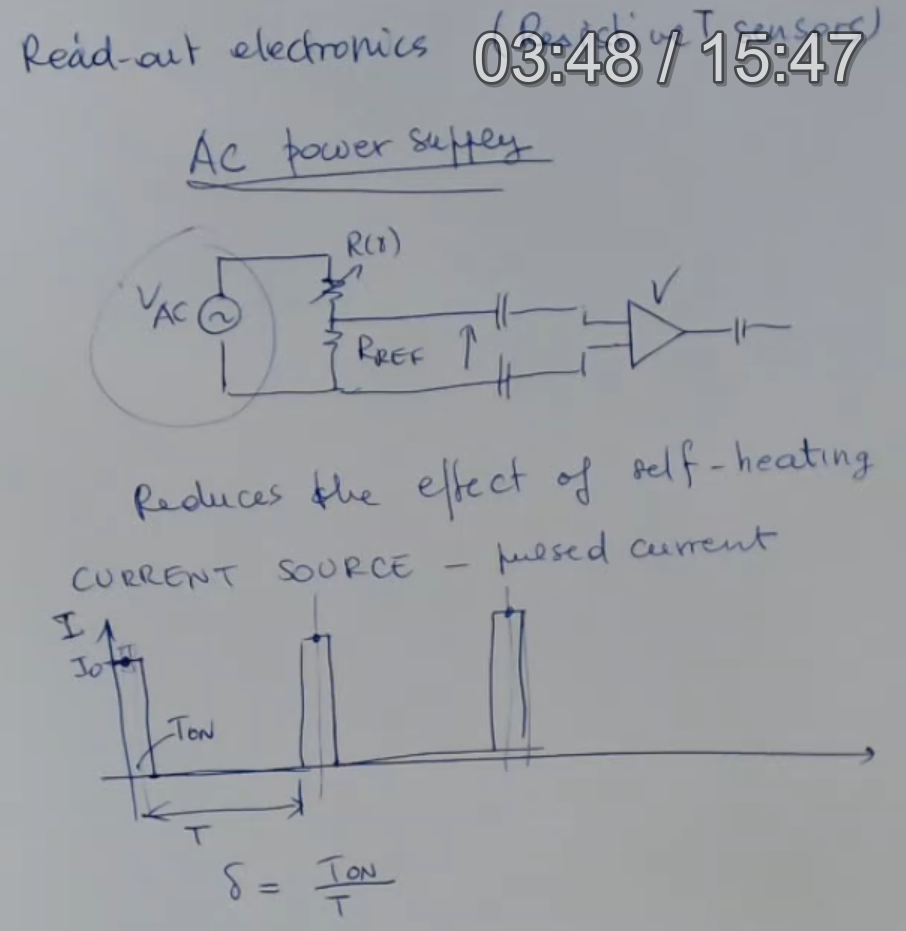
- To reduce this problem we have seen a method, that we will call “Train of Pulses”, which consists in changing the source from a DC Voltage to a repeating square wave function or “train of pulses”.
This special function has 2 distinct periods:- : full period or normal defined period.
- : period in which the source feeds current into the system.
- called the “duty cycle” is the ratio between this two periods.
- ==In this case we need to read the output only during the periods, otherwise we’ll measuring nothing==.
So we need to have an electrical system fast enough to adapt to this pulses, which is usually possible.
- To evaluate how much this approach reduces the effect of self-heating we need to:
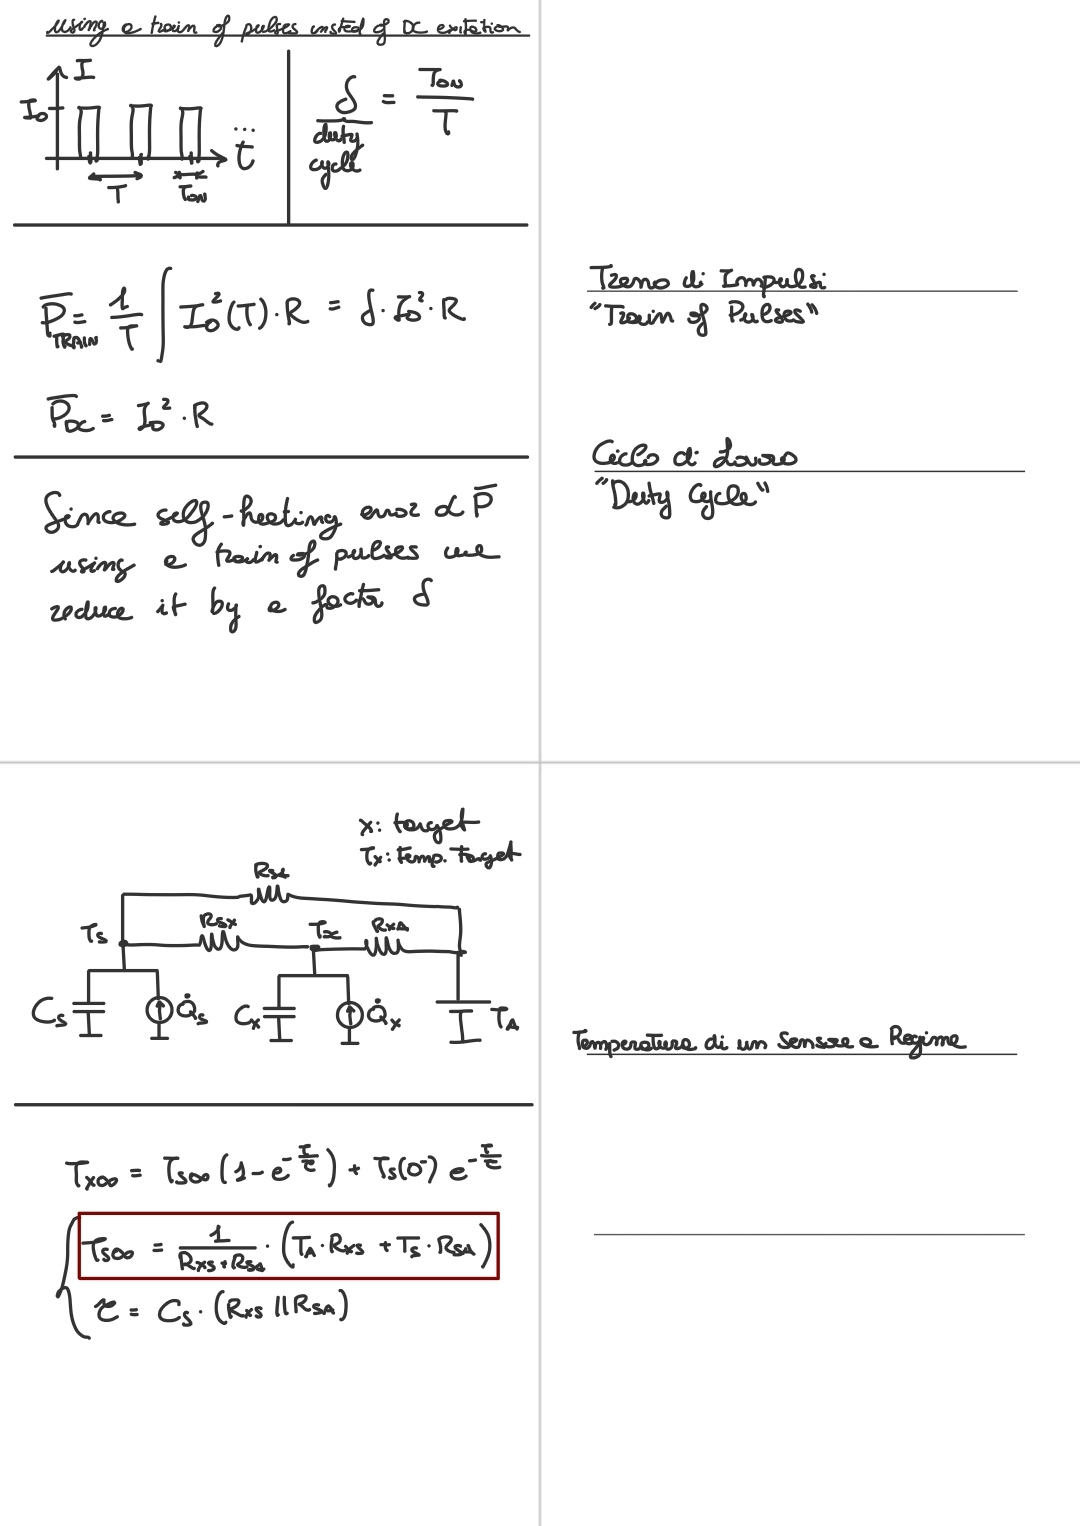
- Construct the thermal lumped parameter system:
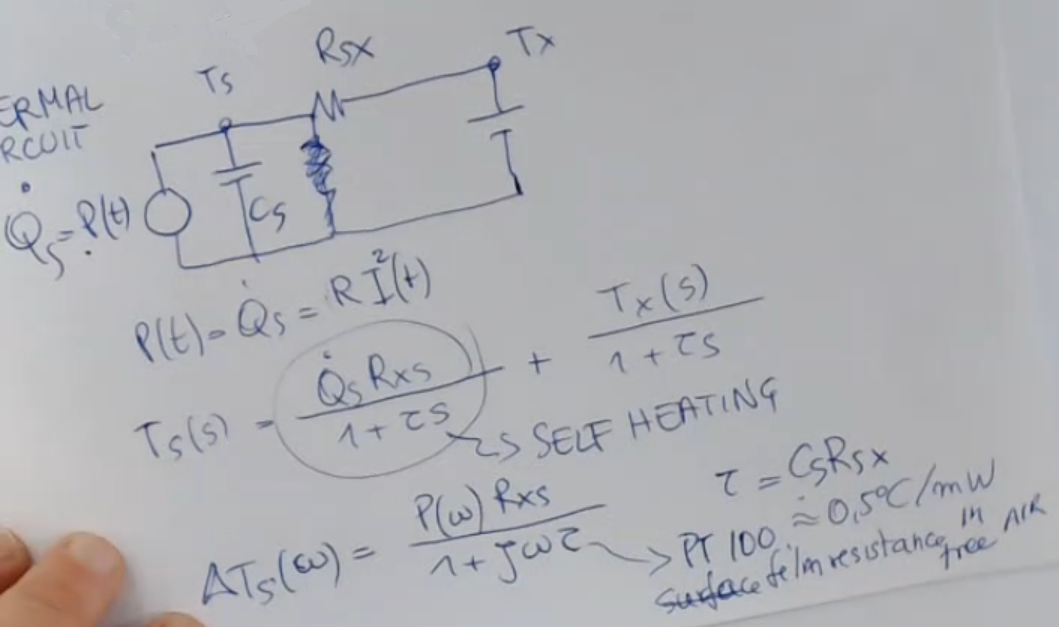
NOTE: The heat flux (the flow quantity of the thermal lumped parameter system), since we consider only the electronic circuit (we are evaluationg only the self-heating effect) is exaclty the power of the electronic circuit.- To find exaclty how much the self-heating value is we need to find using the laplace tranformation and isolate the part containg , the result will be:(This is not so imporant)
==While it’sIMPORTANTE to remeber that the PT100 as any other sensor suffers form self heating, in actual number the measured value changes of about ==.- Since the self-heating depends directly to , if we reduce the power or medium power, we will reduce the self-heating effect, so we can calculate:
- So the final result is that, if we use a train of pulses instead of a DC input, we can reduce the self-heating effect by a factor of (the duty cycle):
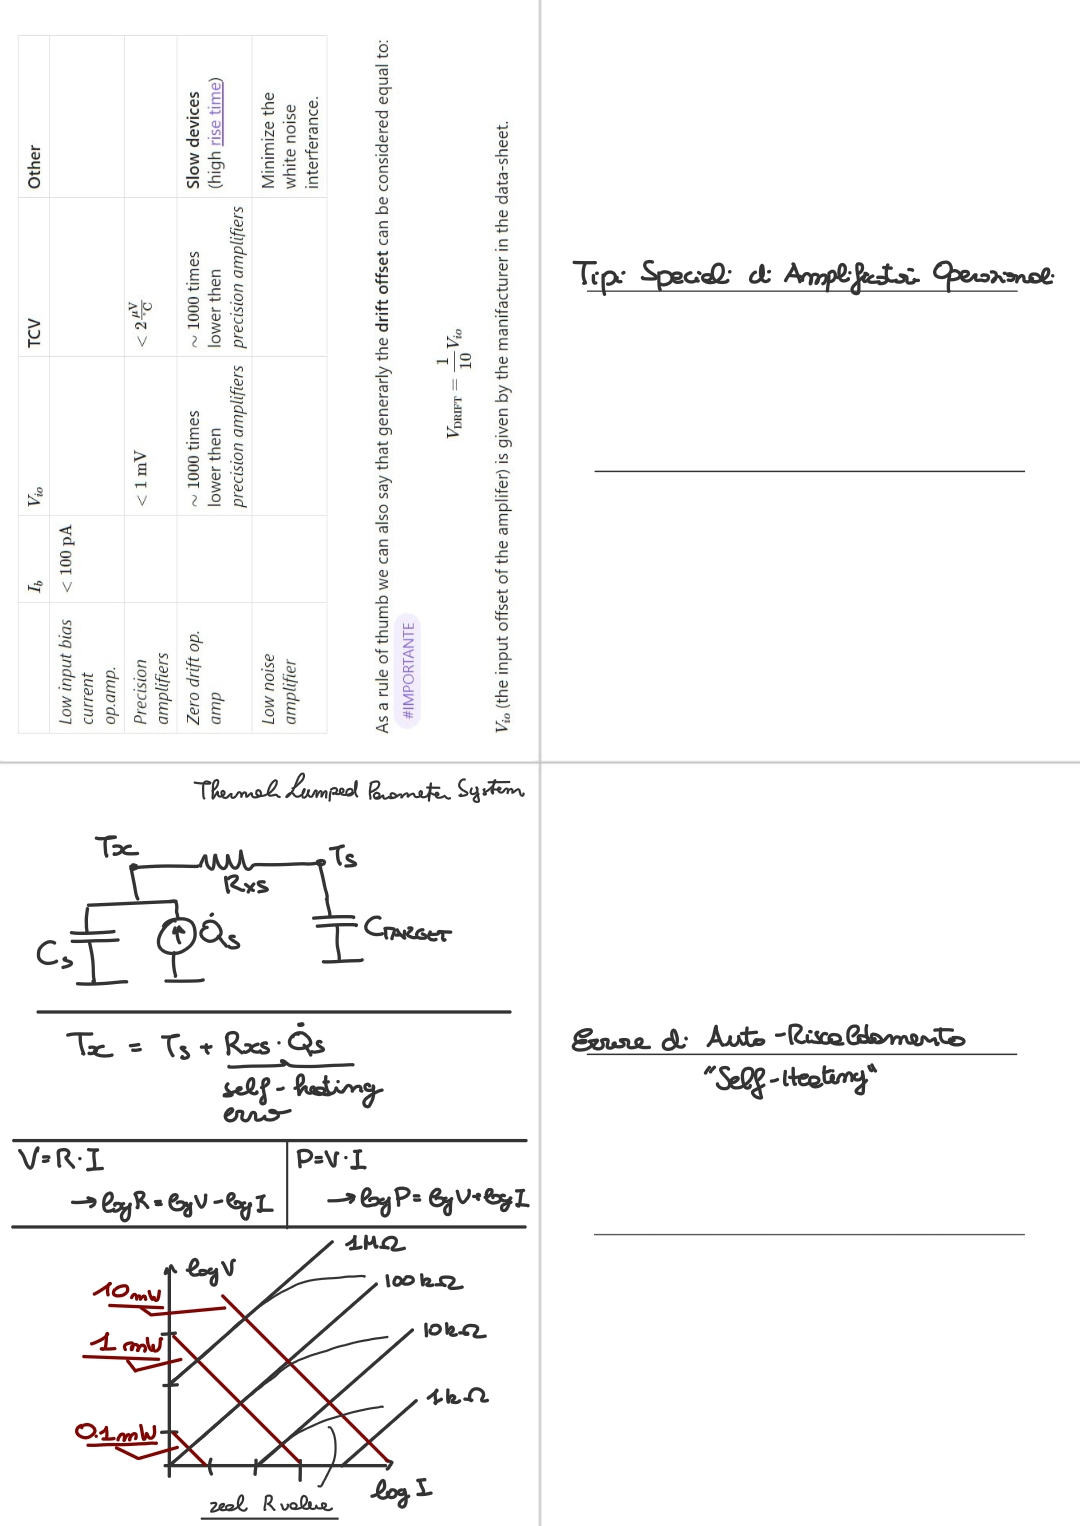
- Often you find this kind of diagram to relate in logaritmic form the voltage and current:
- Each diagonal line represent a different resistance value, or a value for power following the formulas:and:
- This diagonal lines are ideal, but due to self-heating the relationship between and is not linear, as show under.
- If I draw lines which describes different constant powers, you will have this behavior here, due to self-heating:
> - You see that resistance remains with the same value until something happens due to the fact that the power is too high (self-heating), and the resistence value tend to diminsh.
- Usually these diagrams are drawn wiht a constant, usally taken at ambient temperature (), the medium being air.
Memory Card
Index
- Train of Pulses
- Thermal Circuit
- Low Pass Function
- Fundamental Frequency on Train of Pulses
- DC Errors on Train of Pulses
- ~ Real World Example • How Data Sheet Represent Self-Heating
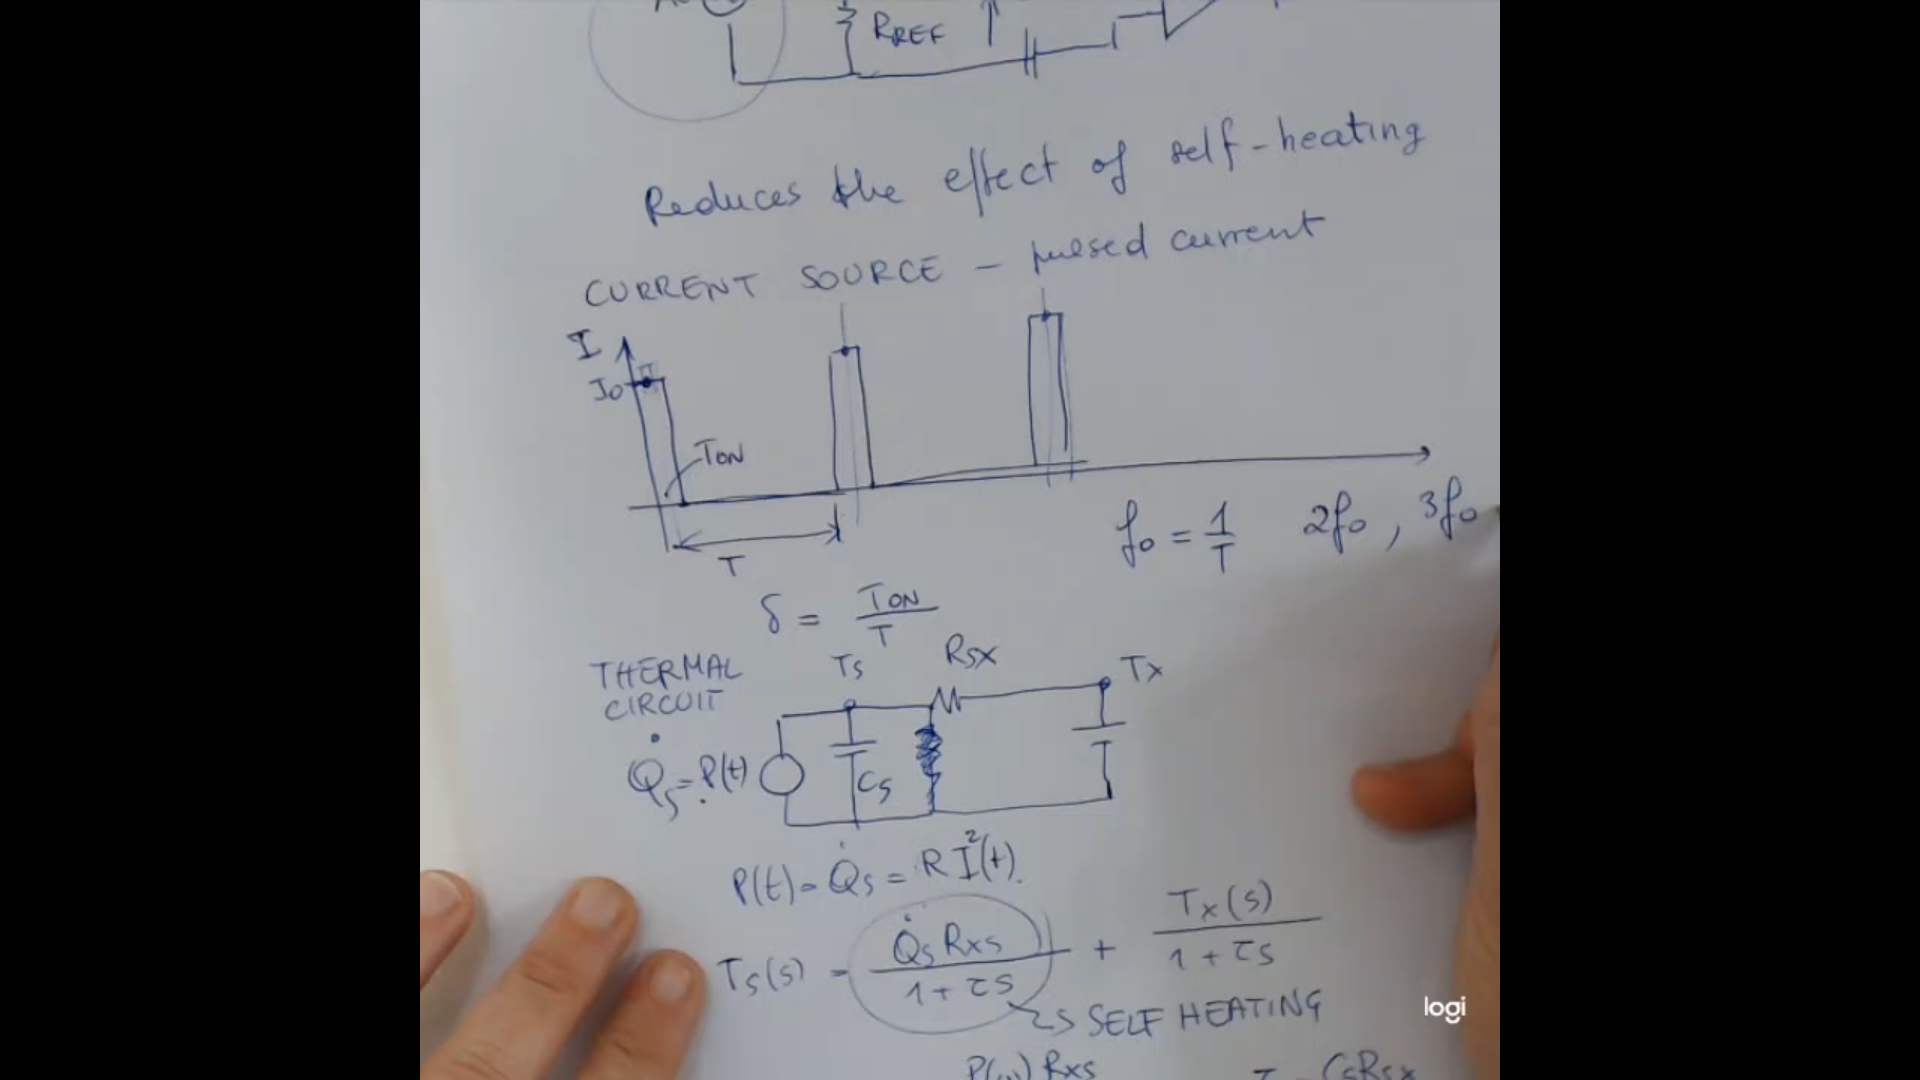
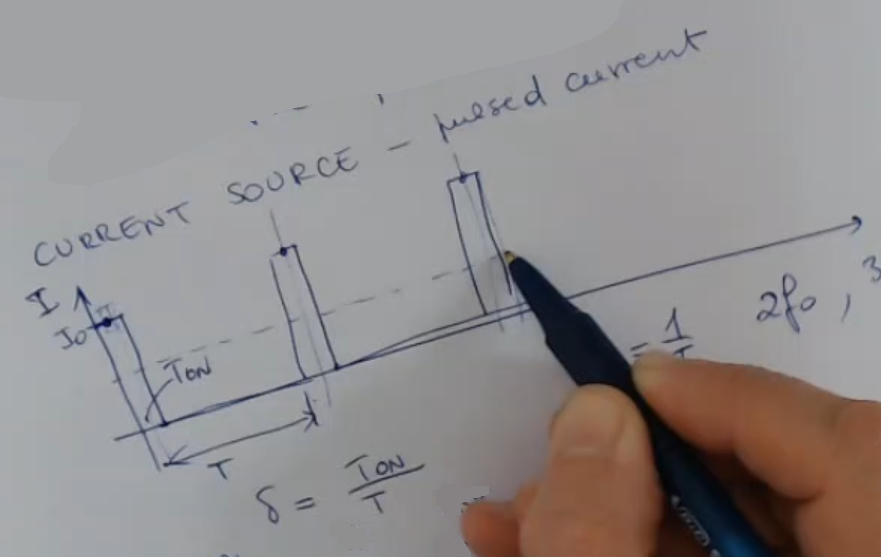
Train of Pulses
- The idea of having variables power for the resistance can be useful also to reduce the effect of self-eating.
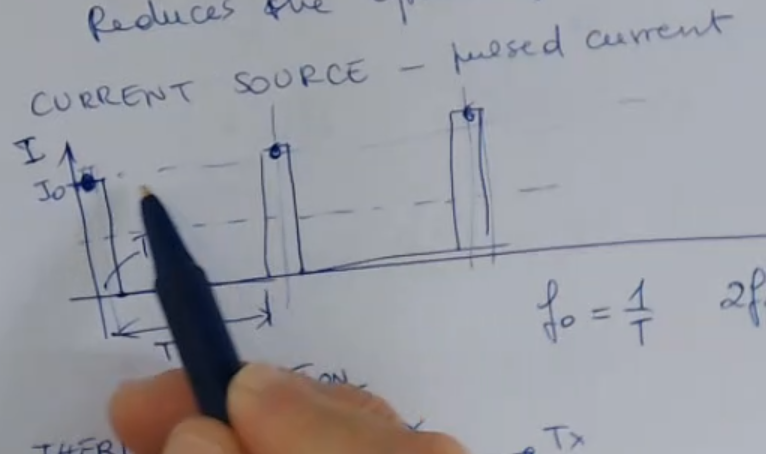
- In fact, you can use for instance a current source which generates a train of pulses.
- ==So we can draw our current which I input to the resistance, with a defined “full period” from one pulse to the other, and another much shorter period where the generator is on (the period of a pulse of current)==.
- ==So, the duty cycle is defined as the divided by the full period ==.
- And obviously you have to perform the reading during the period .
- So you should have an AD converter, which converts only in periods where the power is on.
- And this means that you need something which synchronizes the excitation and the reading of the resistance.
Definition of Duty Cycle: ==The duty cycle is a term commonly used in electronics and signal processing to describe the ratio of the time a signal is ON (active) compared to the total period of the signal.
It is often expressed as a percentage==.
Thermal Circuit
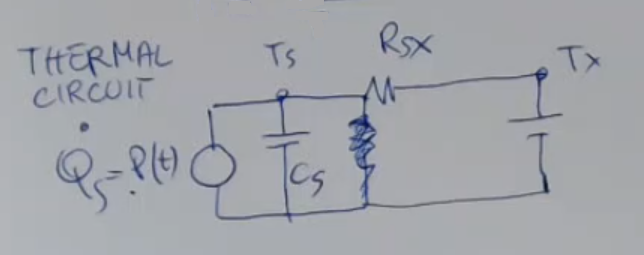
- Here you have an equivalent thermal system (or circuit), where you have your sensor, with temperature , and the thermal capacitance of the sensor,
- ==We have that the power which is the heat flux () that we give to our resistance is equal to .
will vary with temperature but we consider it constant or almost constant. - So the temperature of the sensor ase we have already seen it is (in Laplace domain)
- ==The first component of the equation is the error we have for self heating==.
- ==We can go to the freqency domain and write the error as ==.
- == recall is due to the product of the thermal resistance and the sensor’s thermal capacitance==.
- As an example we consider as a PT-100 surface film resistance, that is something which is approximately , which is typical value that you can find.
So we have that the self heating effect (for a simple body+sensor example) is defined as:
Low Pass Function
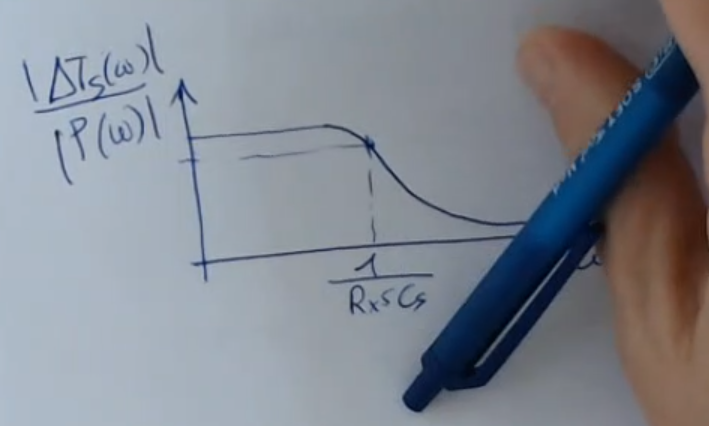
- The error (self-heating effect ) divided by the power you give to your sensor, in the frequency domain, it’s a low pass function.
Fundamental Frequency on Train of Pulses
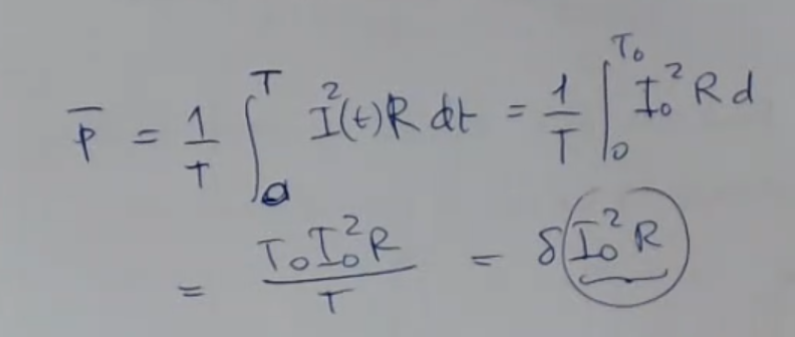
We have defined the power as
Where is defined as a train of pulses:
- ==So you will have a fundamental frequency ==
Let’s represent our , and obviously also the higher harmonics (, , …) all above the cutoff frequency of the thermal filter: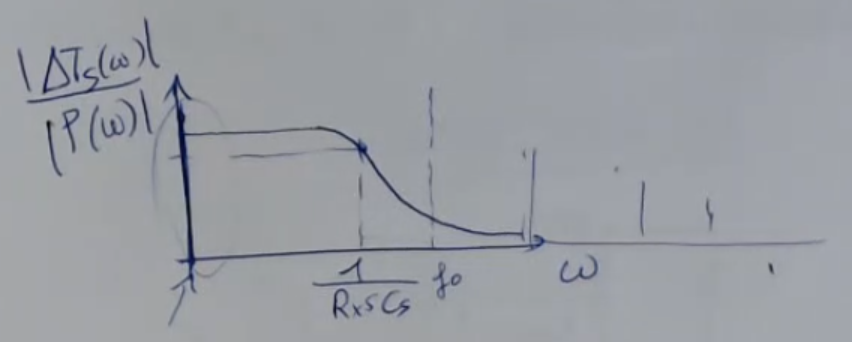
- Then the only thing which you will have, as a steady state response, is the average value, (the delta at ), which represents the DC component of the power.
The dotted line represents the DC component of the generator:
We can evaluate it:
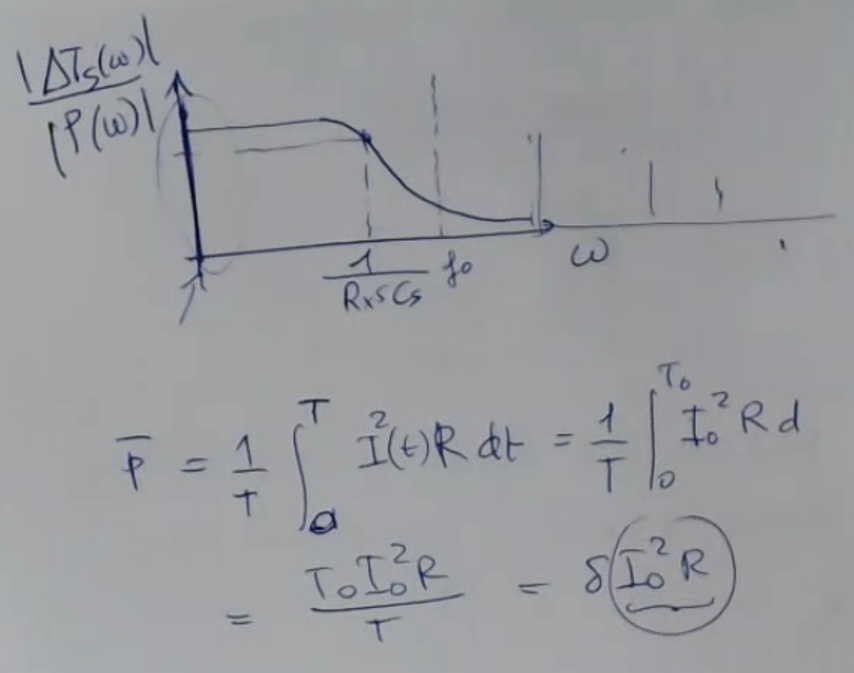
- ==So you have reduced the average power, with respect to the DC, by a factor which is given by the duty cycle ==.
DC Errors on Train of Pulses
Let’s compere now the self-heating error on two different exitation, one pulsed (train of pulses we have seen now) and the other given by a DC power source:
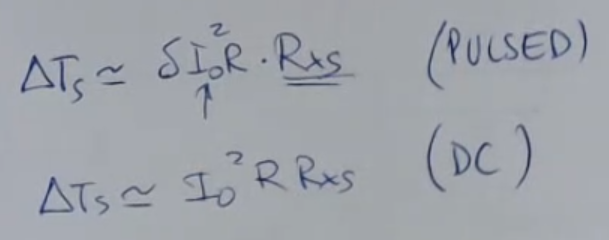
- Both error are considered as “DC errors”, what changes is the exitacion
- So by having a pulsed exitacion, instead of a DC exitation we will have reduced the error, by a factor of the duty cycle.
I need to read the resistance at the points where the generator is on, where for a brief moment the currnet is costant, that's why we call it still a DC error:
- We need to have an electrical system fast enough to adapt to this pulses, which is usually possible.
~ Real World Example • How Data Sheet Represent Self-Heating
Often you find this kind of diagram to relate in logaritmic form the voltage and current:
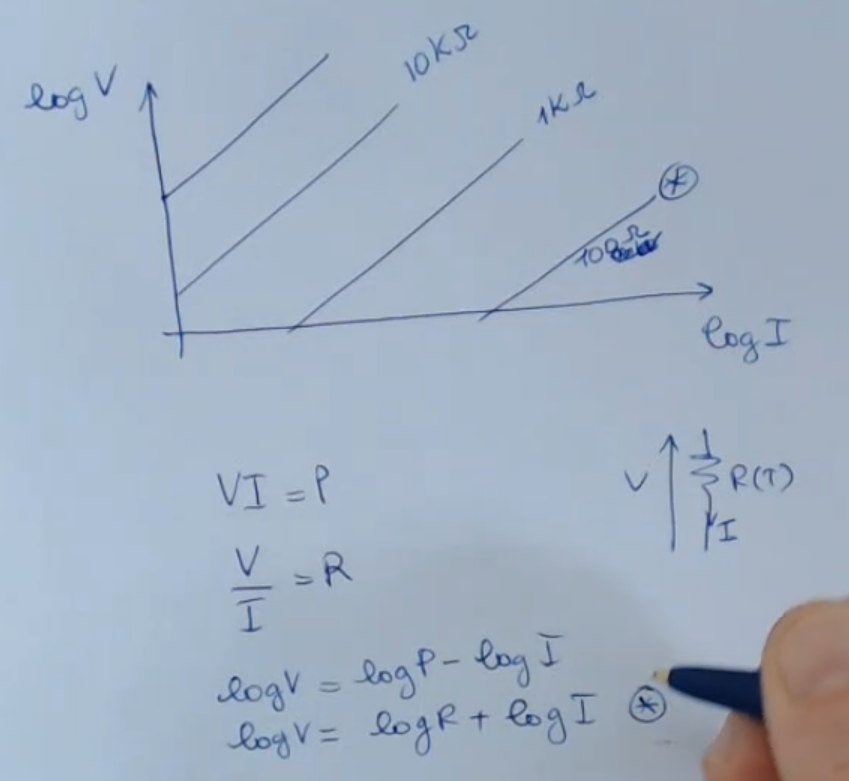
- Each diagonal line represent a different resistance value, or a value for power following the formulas:and:
- This diagonal lines are ideal, but due to self-heating the relationship between and is not linear, as show under.
If I draw lines which describes different constant powers, you will have this behavior here, due to self-heating:
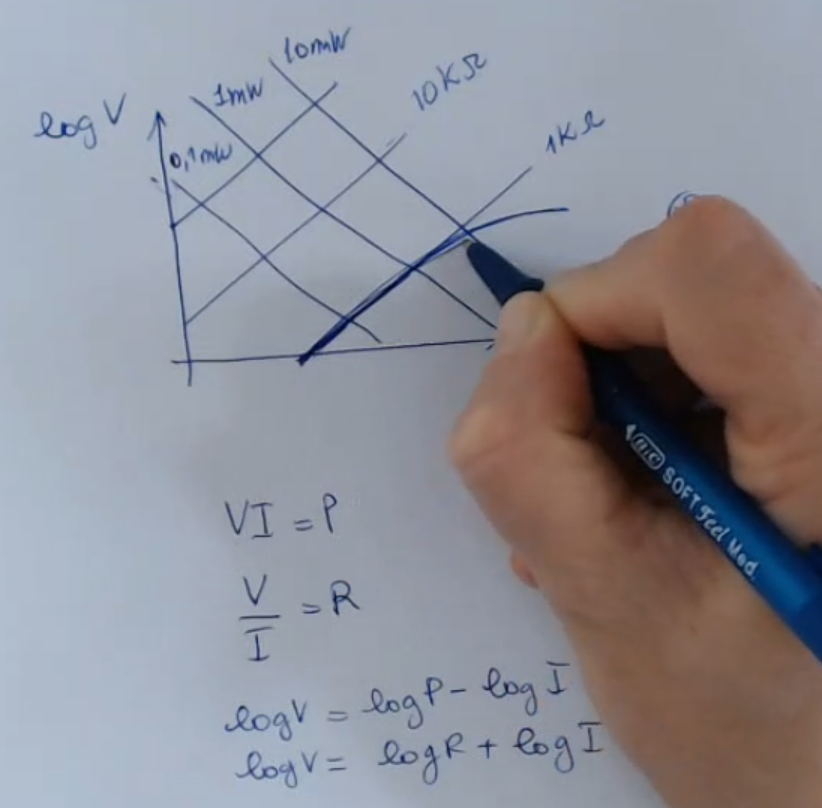
- You see that resistance remains with the same value until something happens due to the fact that the power is too high (self-heating), and the resistence value tend to diminsh.
- Usually these diagrams are drawn wiht a constant, usally taken at ambient temperature (), the medium being air.