Stimulus intensity is plotted on the abscissa and the proportion of yes responses is plotted on the ordinate.
The absolute threshold is defined as the stimulus intensity for which the proportion of trials resulting in yes response is 50%.
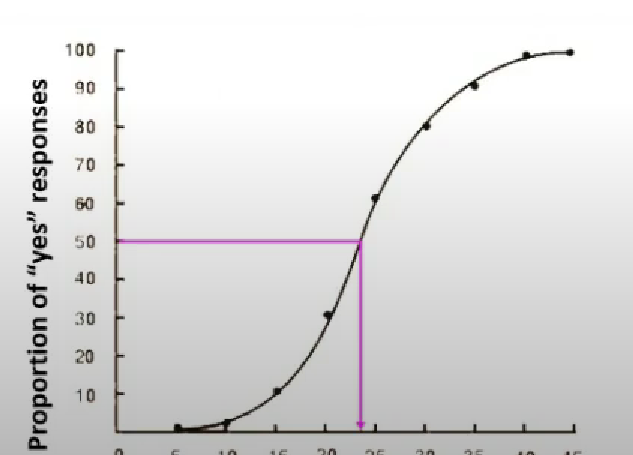
In this case the 50% does not correspond to any of the stimuli used and the curve must be fitted and the threshold estimated.
An ogive curve has been fitted to the points and the stimulus intensity for the 50% point can be estimated as (23 units).
In fact variation of biological and psychological measurement tends to be normally distributed when the frequencies of proportion of measurement of various magnitudes are plotted against the dimension on which variation is occurring, the result is usually the bell-shaped normal distribution curve.
The best fitting curve of the date points in an -shaped function → the psychometric function often follow the ogive shape.
The ogive curve is a cumulative form of this distribution and how the proportion of case below a point on the normal distribution increases as the magnitude of the measurement increases.
The psychometric function can be determined by determining the best fitting through a mathematical technique (~ex.: the method of least squared). The resulting estimation describe the values that minimizes the squared deviations of the empirical values from the function.