Remember:
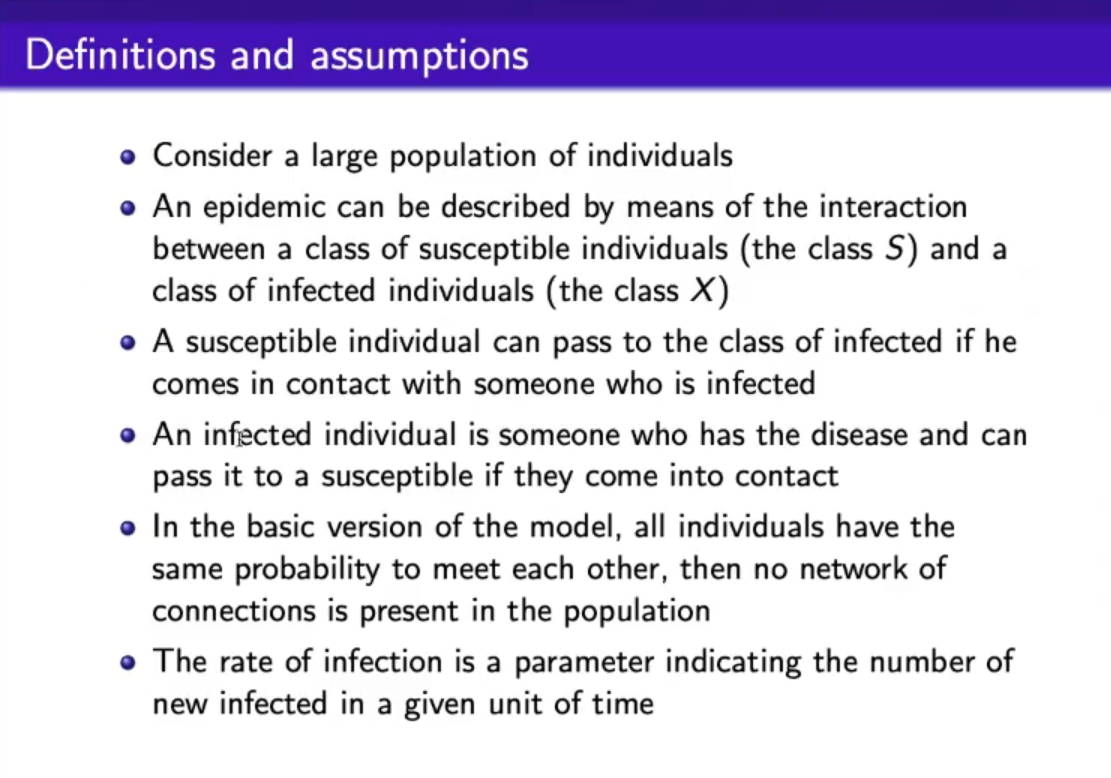
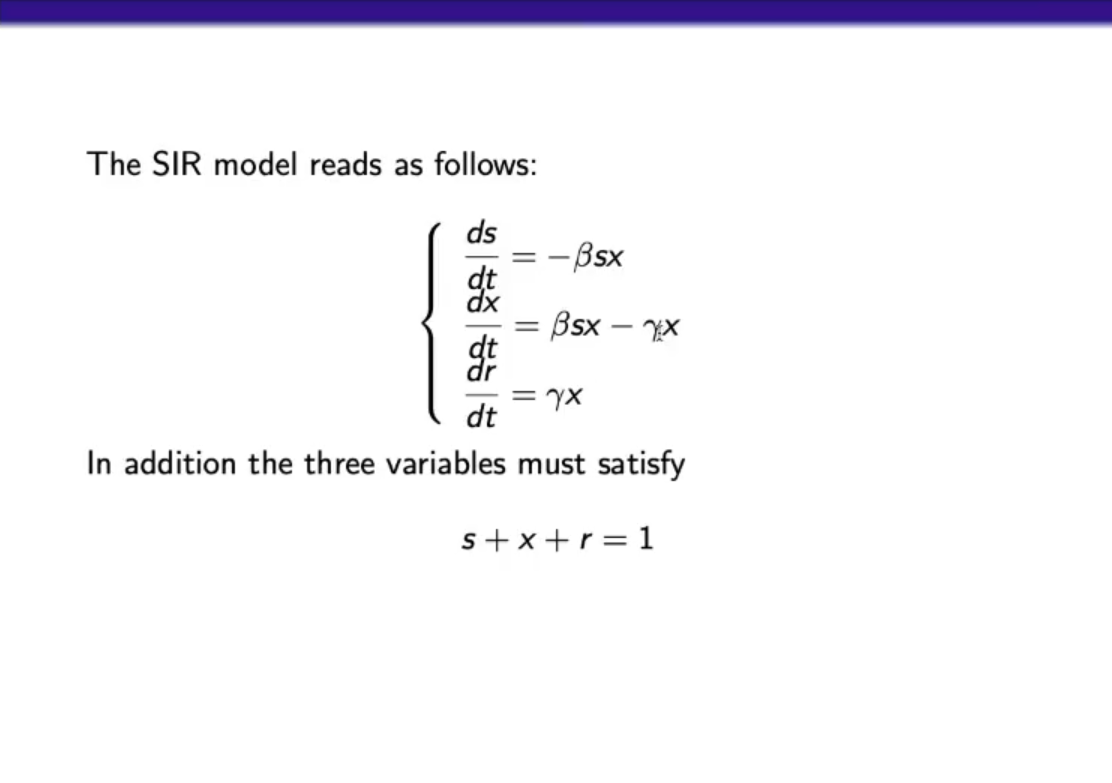
SIR: Susceptible, Infectious, or Recovered
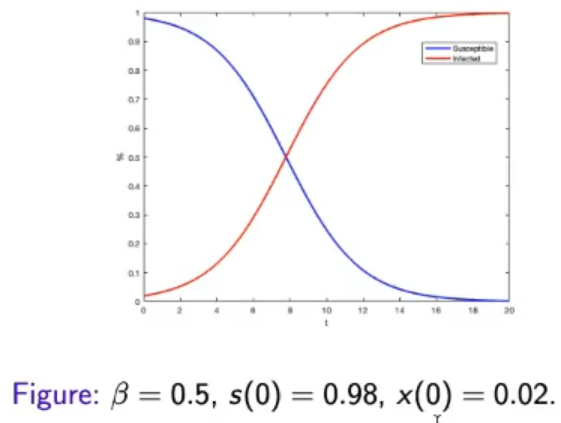
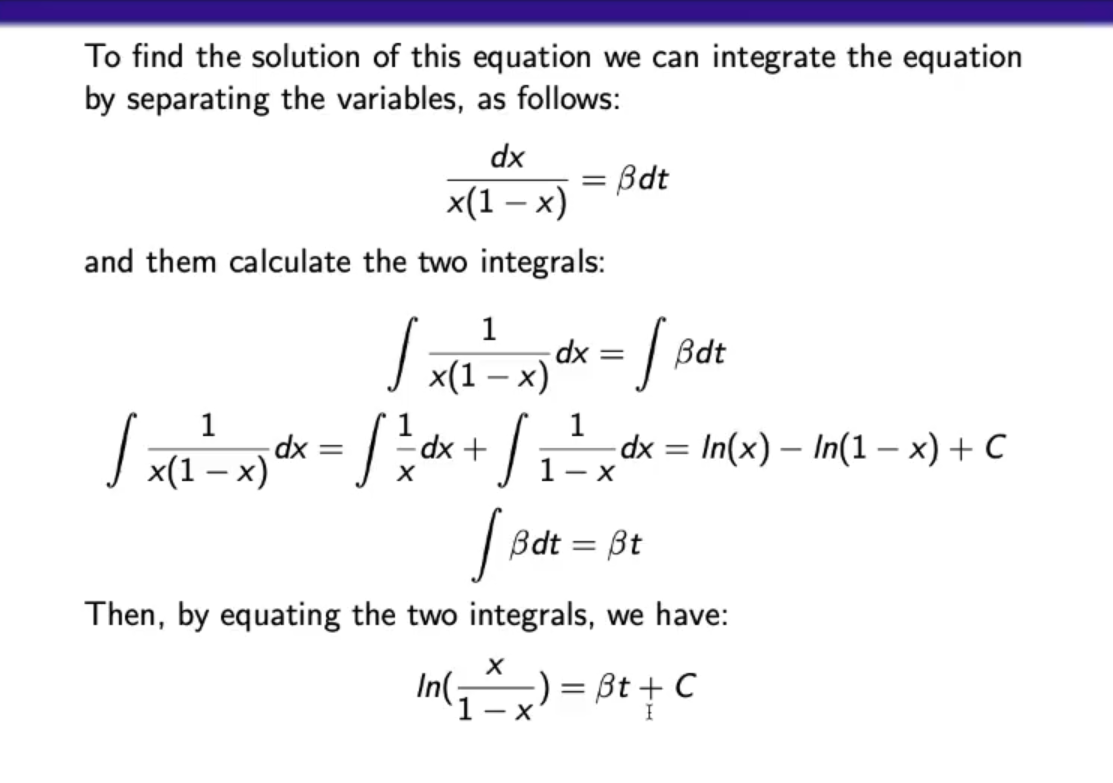
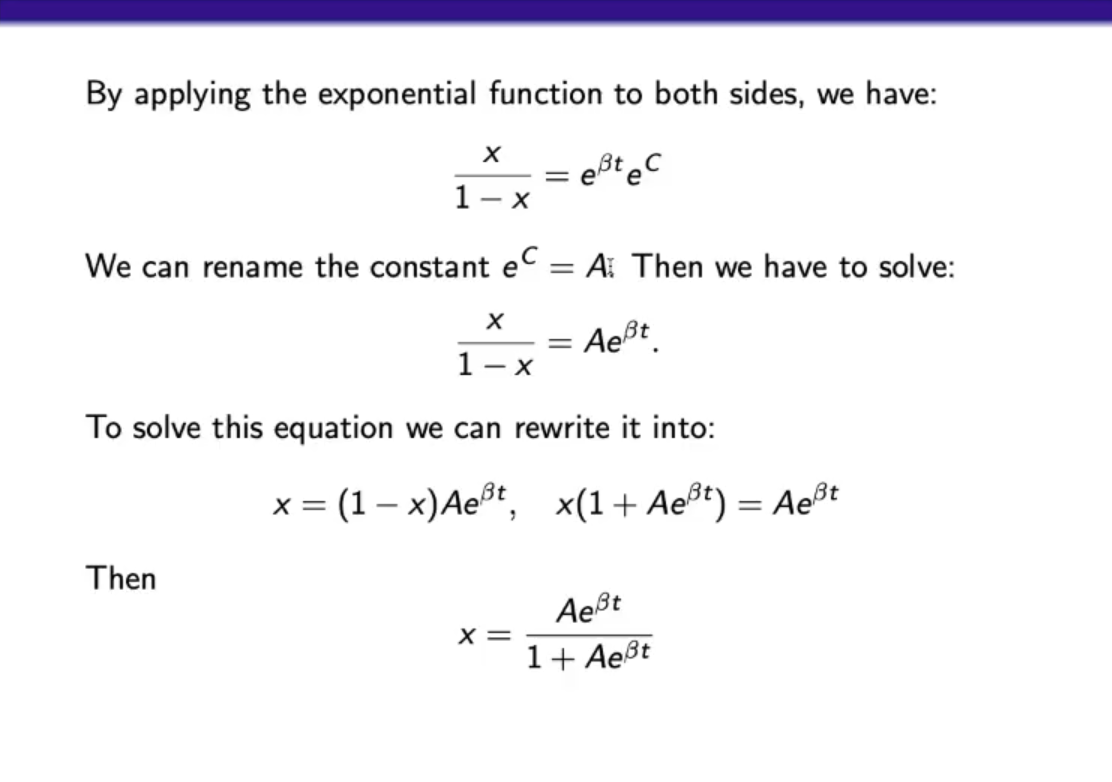
Reduced SI Model:
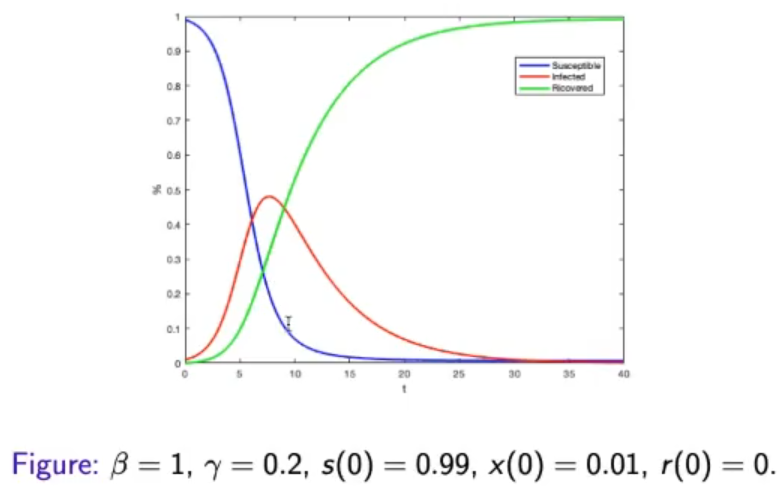
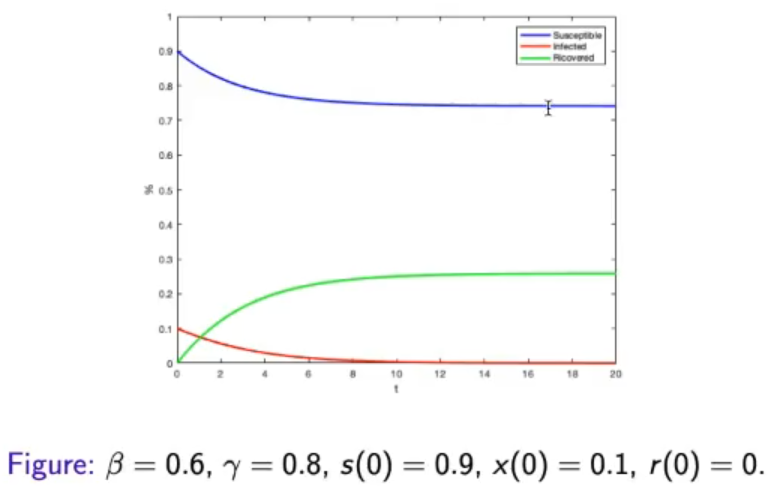
SIR Model:
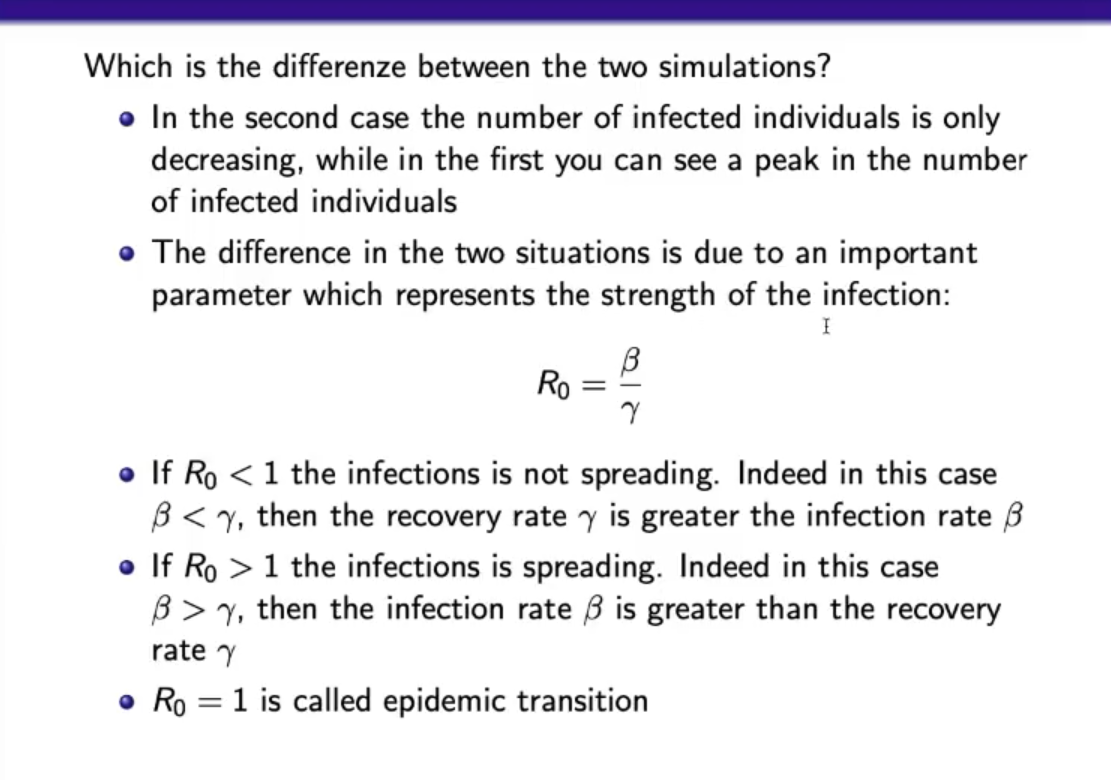
index: the simplest definition is:And it defines:
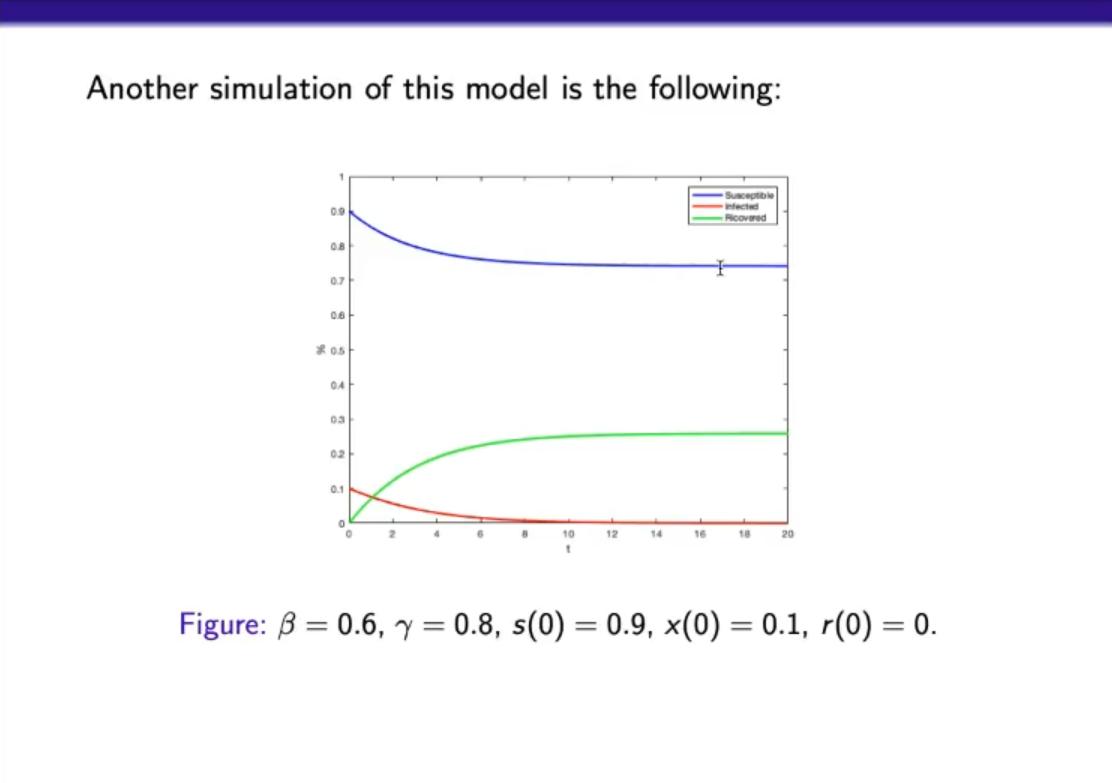
- If , the infection is not spreding.
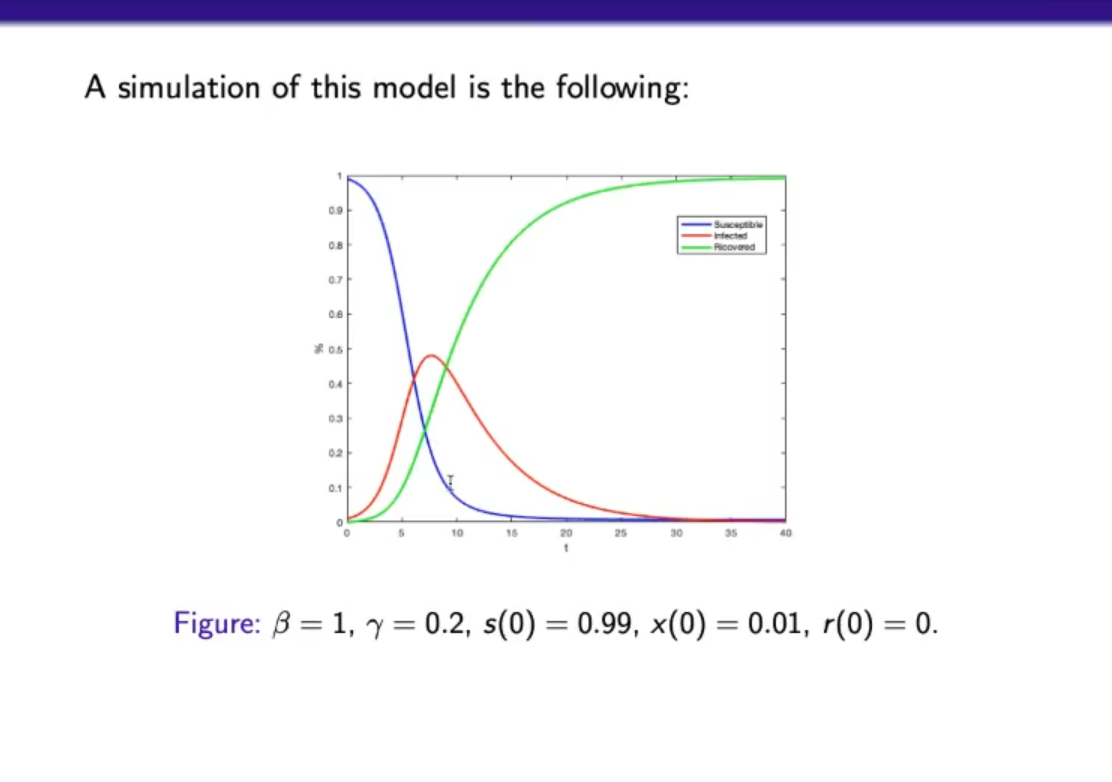
The recovery rate is grater then the infection rate .- If , the infection is spreading.
- is called “epidemic transition”.
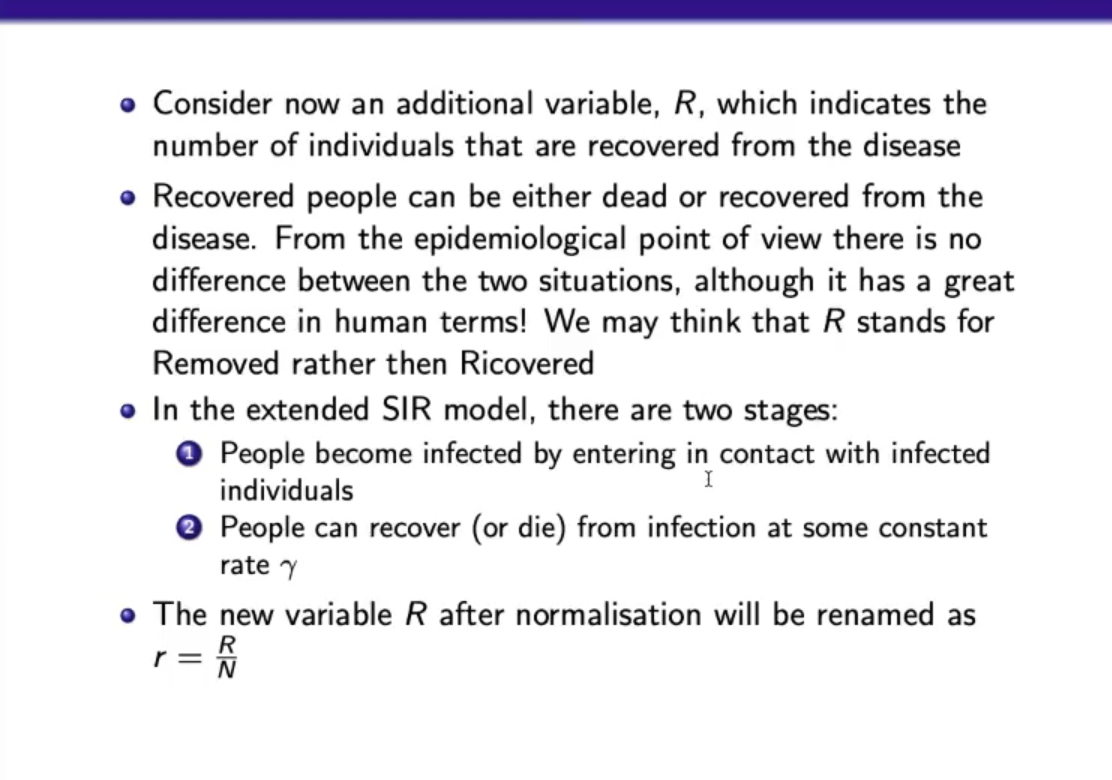
Extended SIR Model (1):
Extended SIR Model (2):
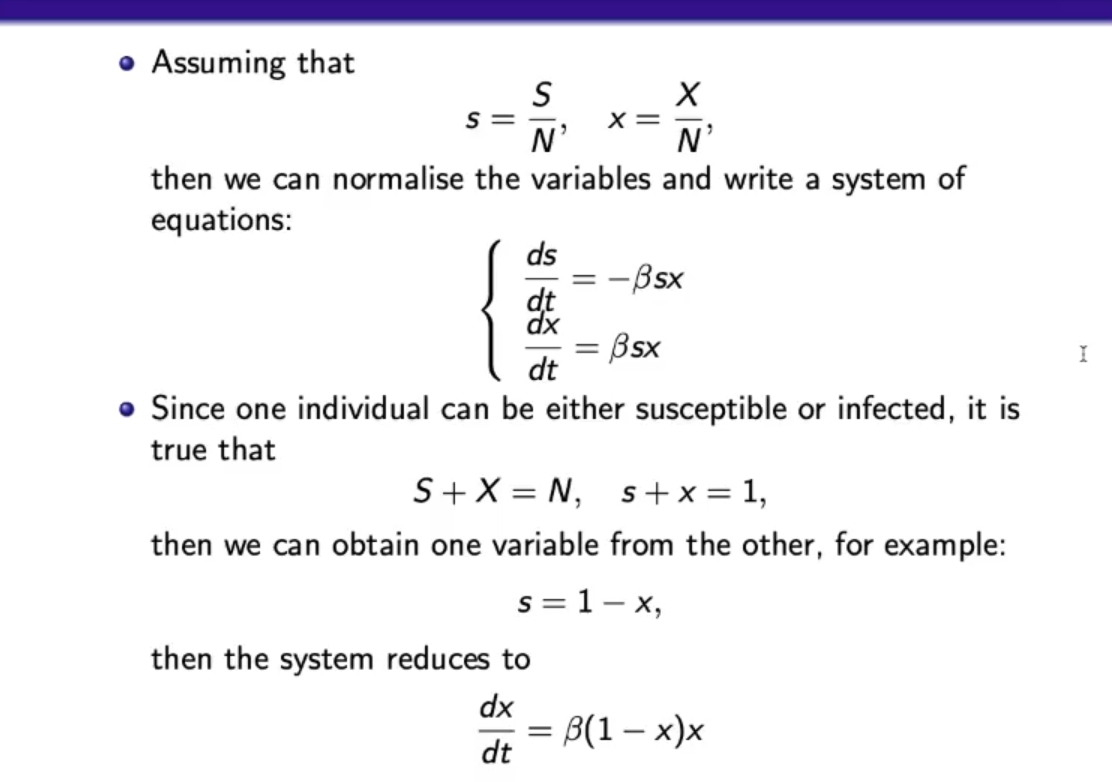
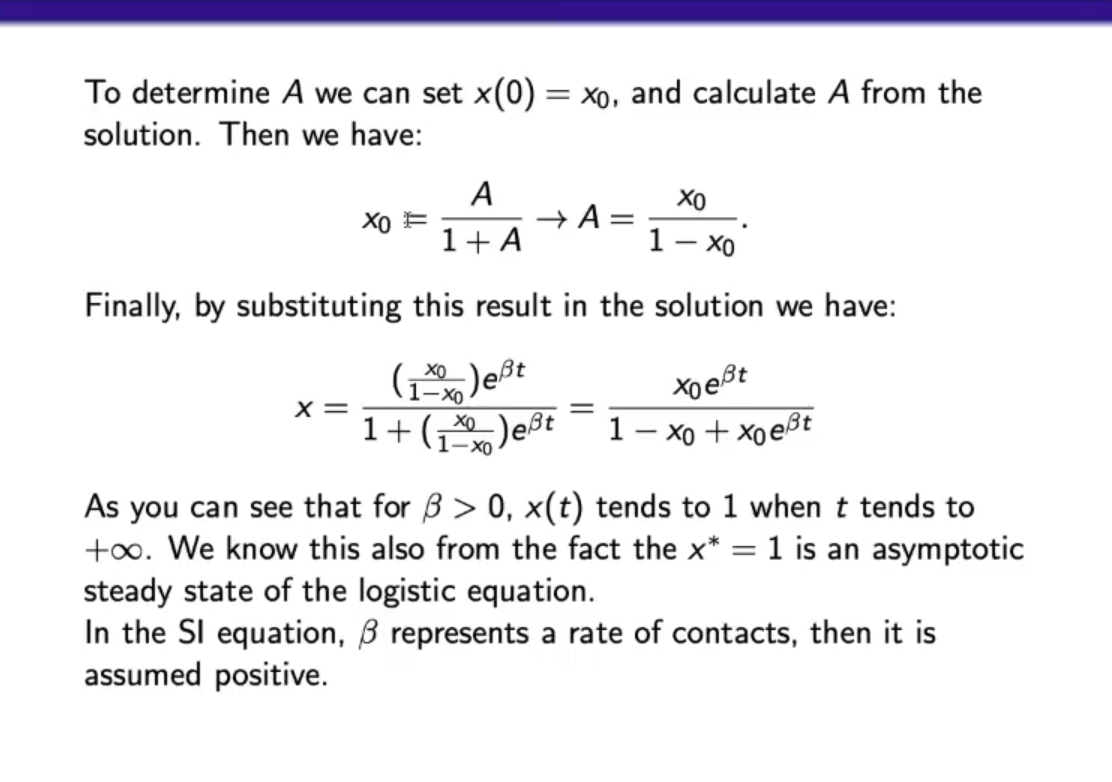
In the simplest case we can solve this problem analytically and find the solution , which wil be in the form: , and as you can see for , then will tend to for . We also know that this also from the fact that is an asymptotic steady state of the logistic equation. In the SI equation, represents a rate of contacts, then it assumed positive.
The SRI Model:
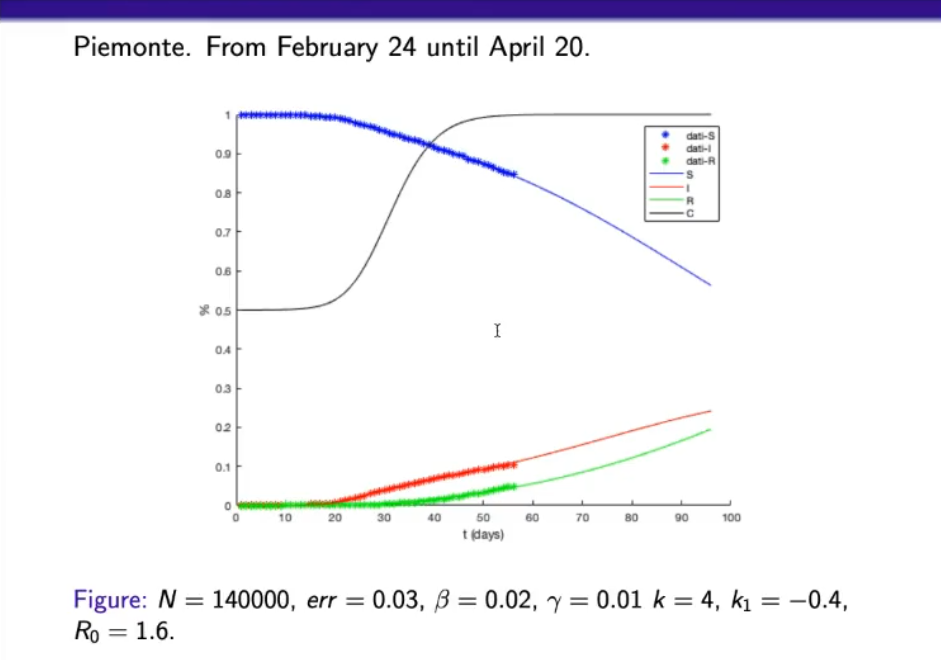
We have used this model to predict the infection rate for the coronavirus in Italy, however, this is still a simplied model, and does not represent correctly what is really happanening, the estimation is not correct:
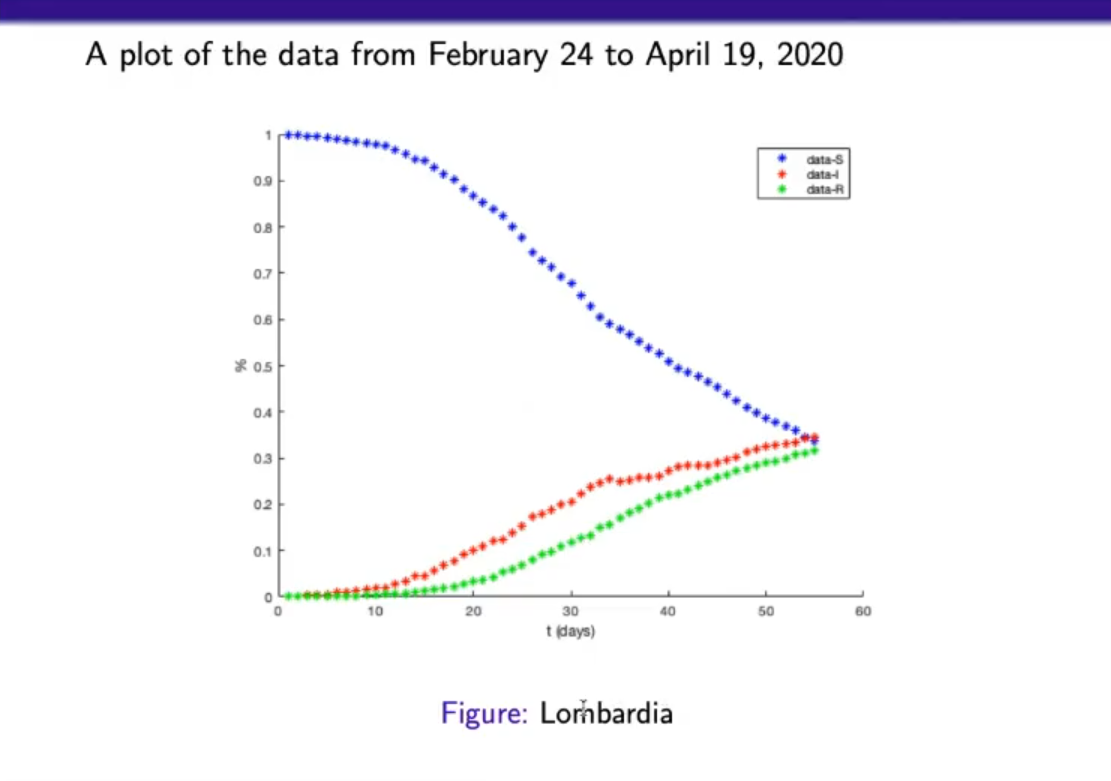
This represents the data quite well:
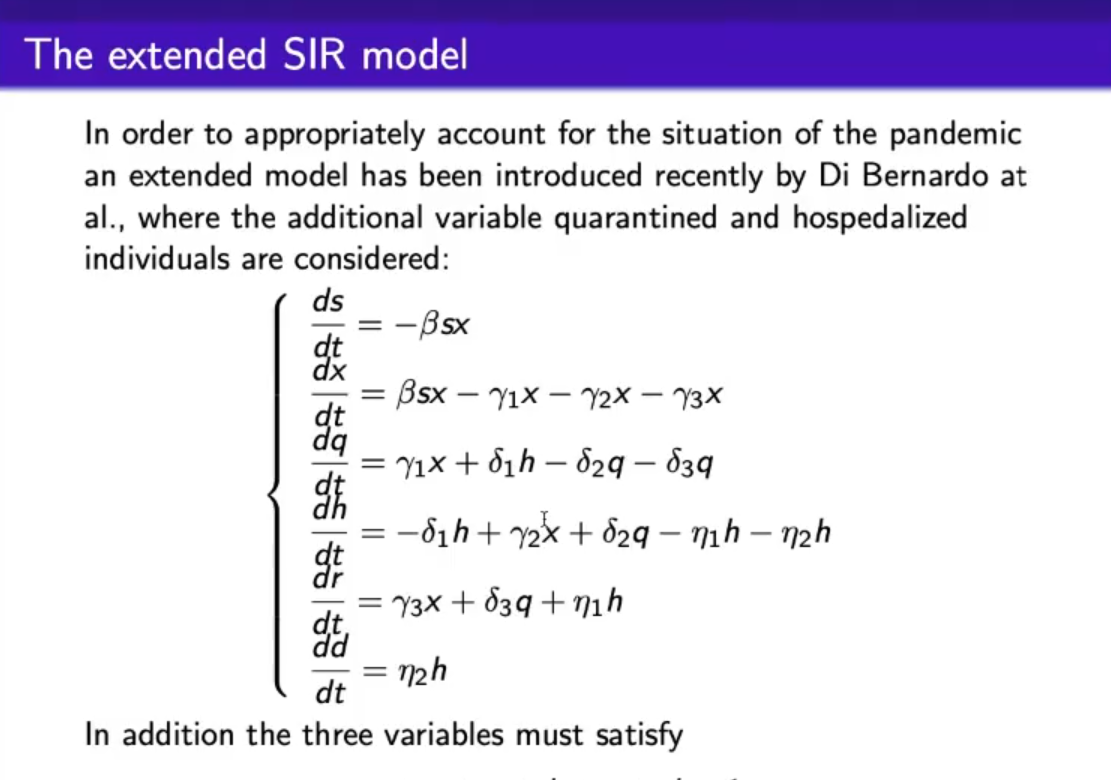
The extended SRI Model:
- This model accounts also for quarantined individuals and for hospitalized individuals .
- : number of contacts between susceptible and infected.
- : individuals from infected to quarantine.
- : infected ⇒ hospitalized.
- …
- : hospitalized ⇒ deceased.
- NOTE: That for each equation, the negative part all depend on the respective variable itself, otherwise the variable would become negative in the long run, and in this case each parameter/variable has to be . (we cannot have a negative number of people)
~Ex.: , the negative terms are and they all depend on .not-sure-about-this But depends on and is positive?? The positive sings means some people that enters in this class from a different one, and the negative sign means that they go from this class to another. Take for example the in hospitalied and dead, they have opposite signs, meaning that some hospitalized people die.
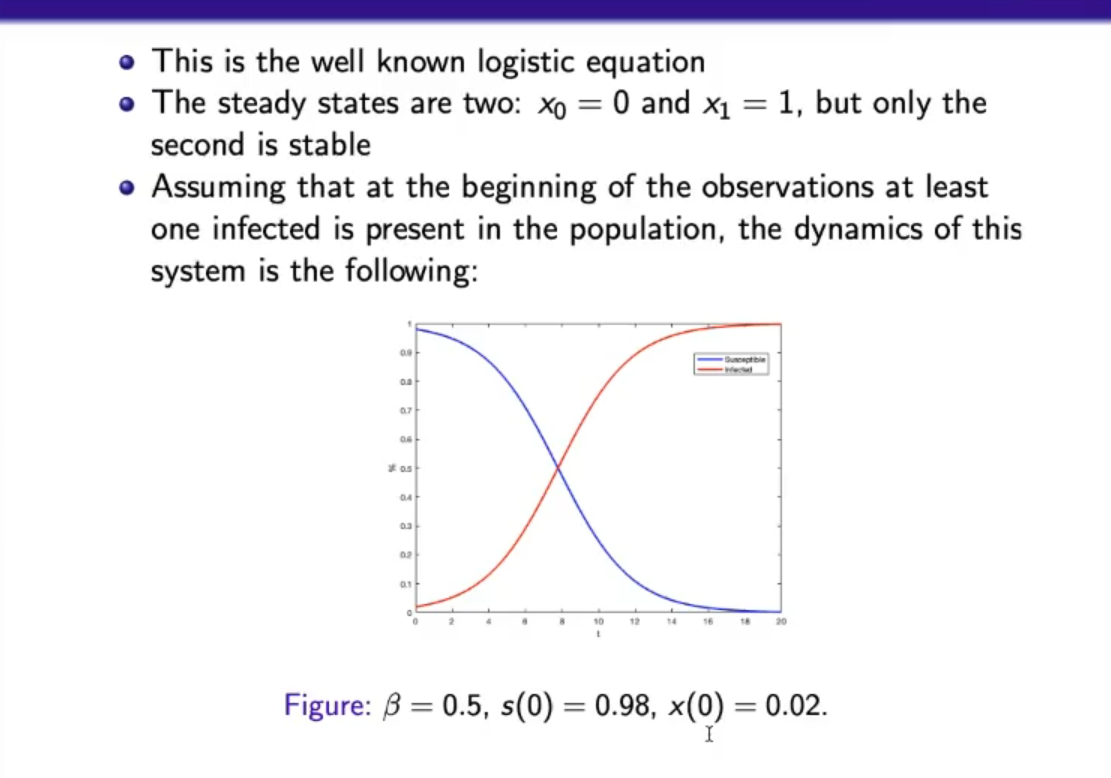
- Analytic solution.
- The susceptible converge to , meaning all people have become infected (and then recovered)
- Different parameters and .
- : strength of infection.
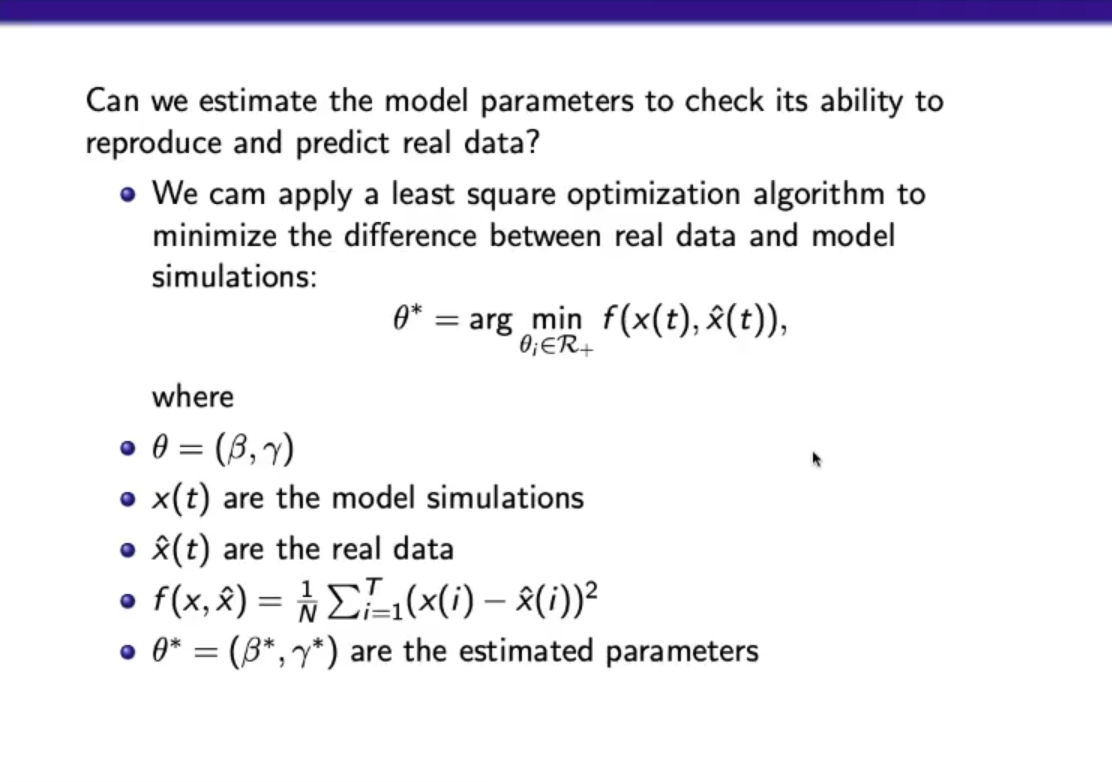
- is the least quadratic model function.
- This is can also be considered a machine learning program.
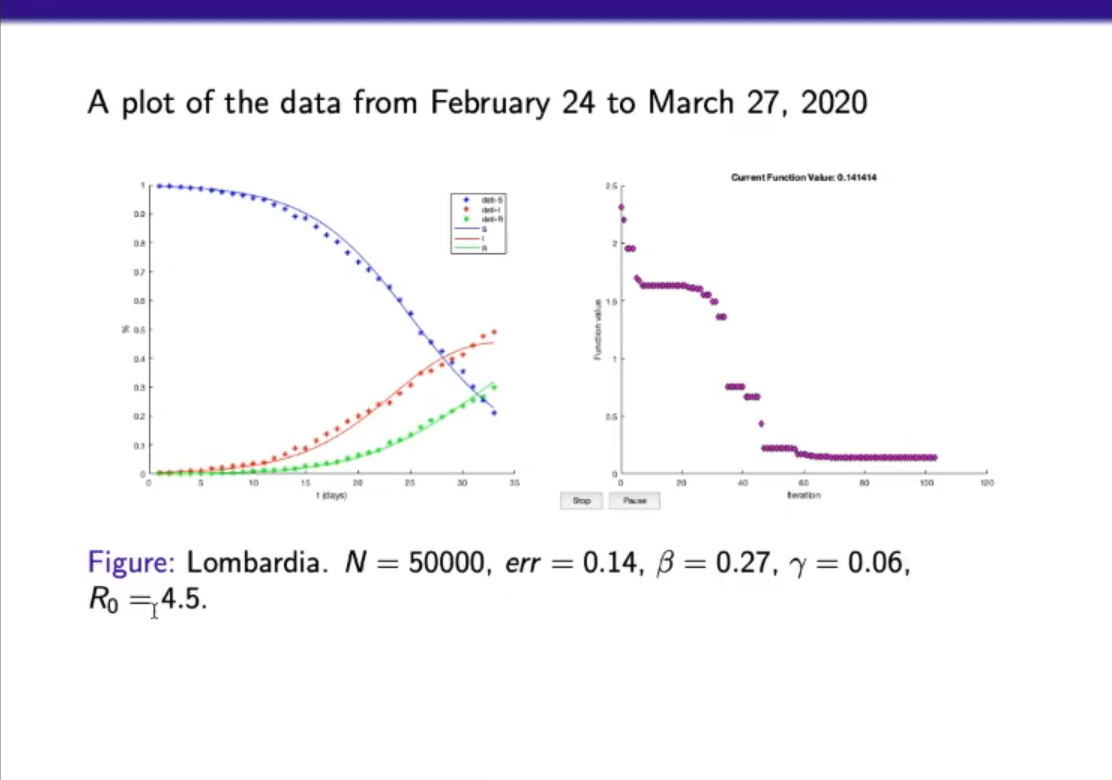
- This are the parameters and found by the previous formula.
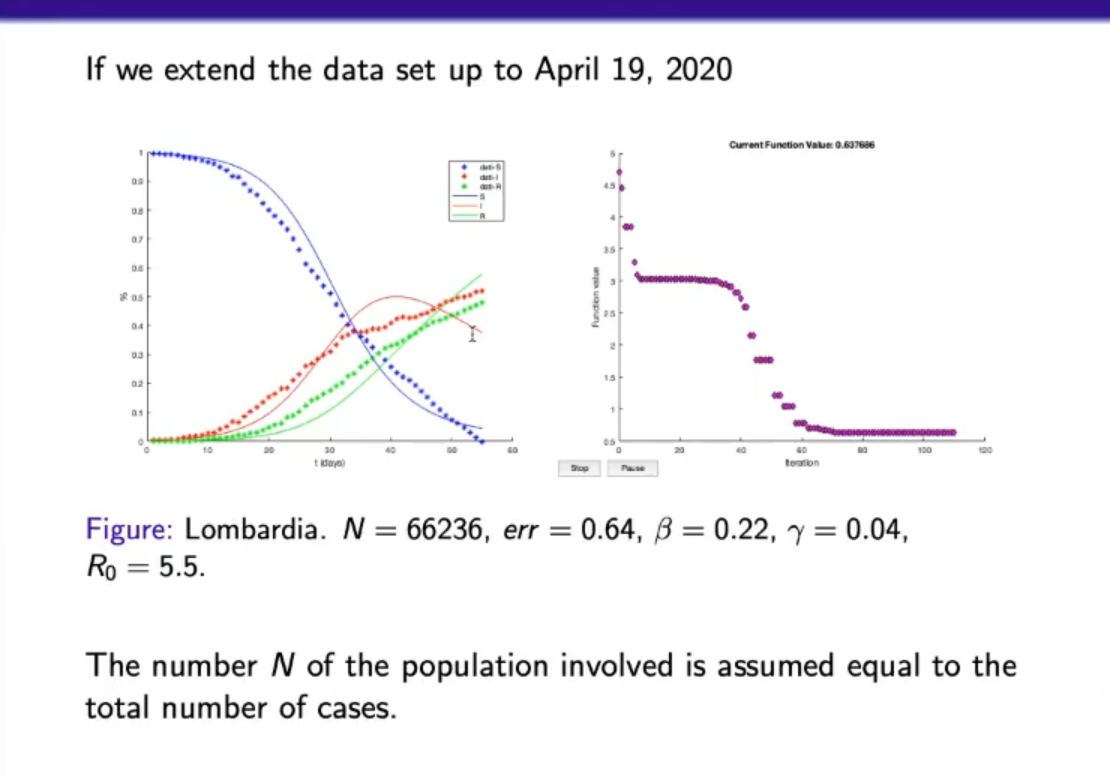
- As we can see the function we found, does not fit correctly the following data.
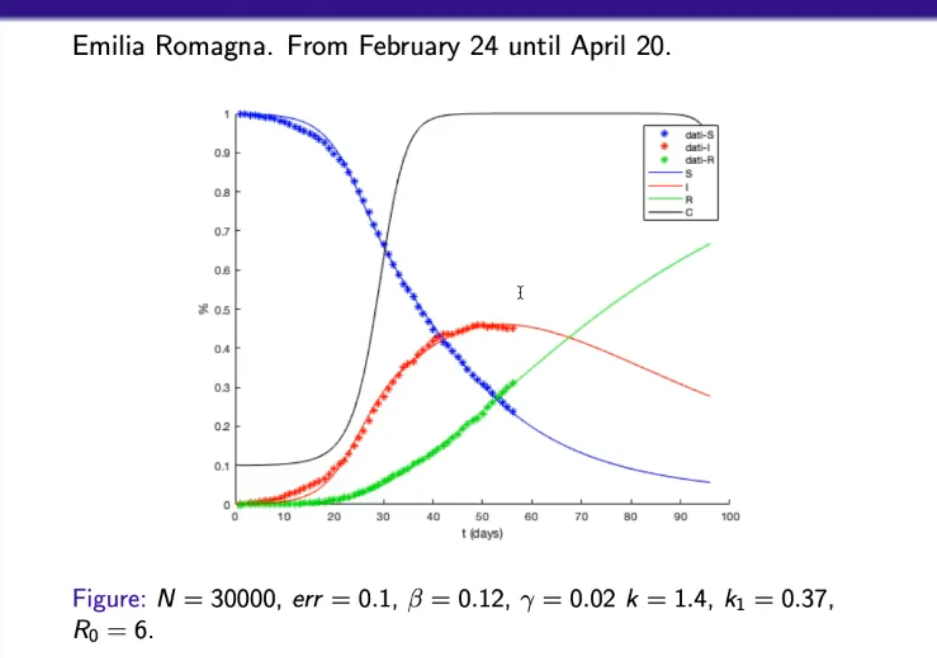
- A more complex, but more accurate model.
- The last formula consider the social distancing and mask used to protect the susceptible individuals.
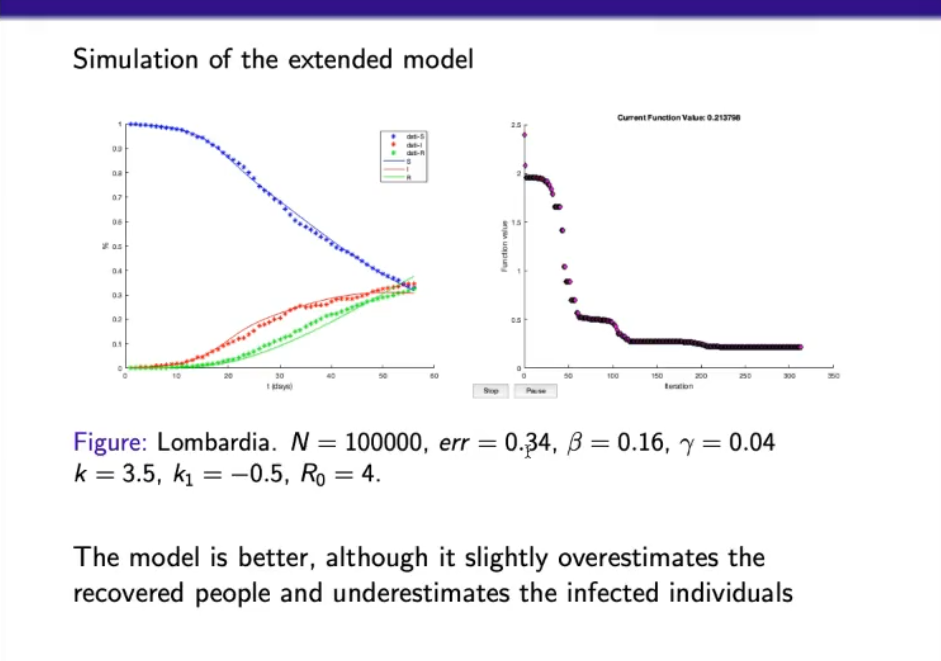
- Now the function fits the data much better.
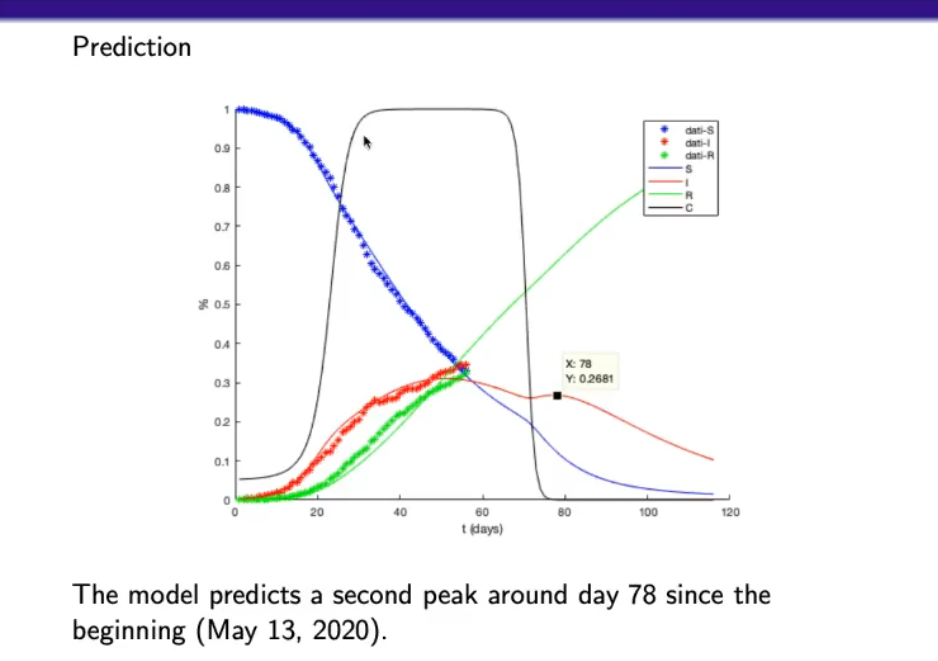
- When the lockdown ends we need to expect a second peak.
- The black line represents the parameter .
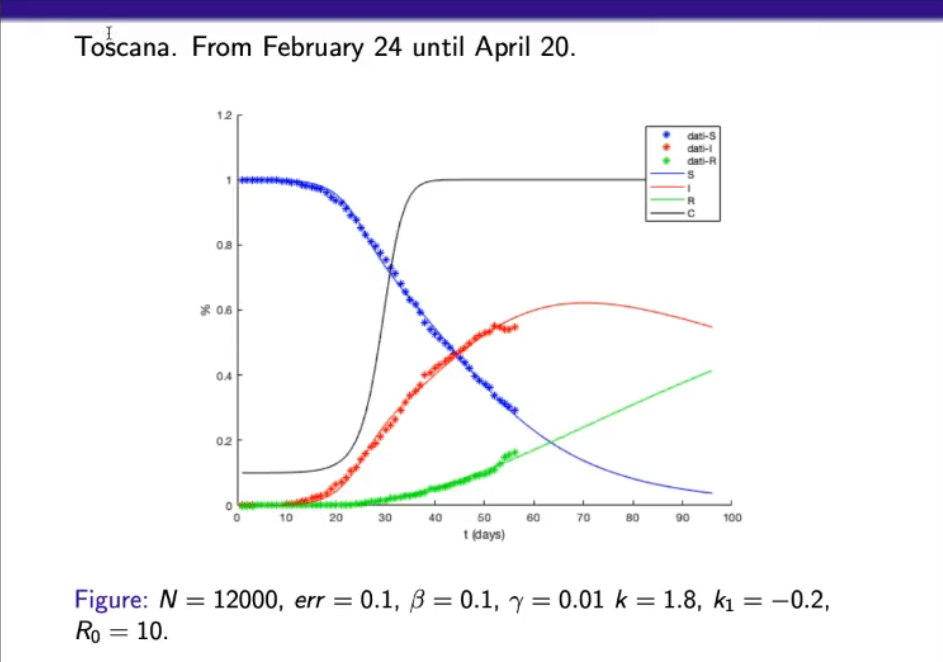
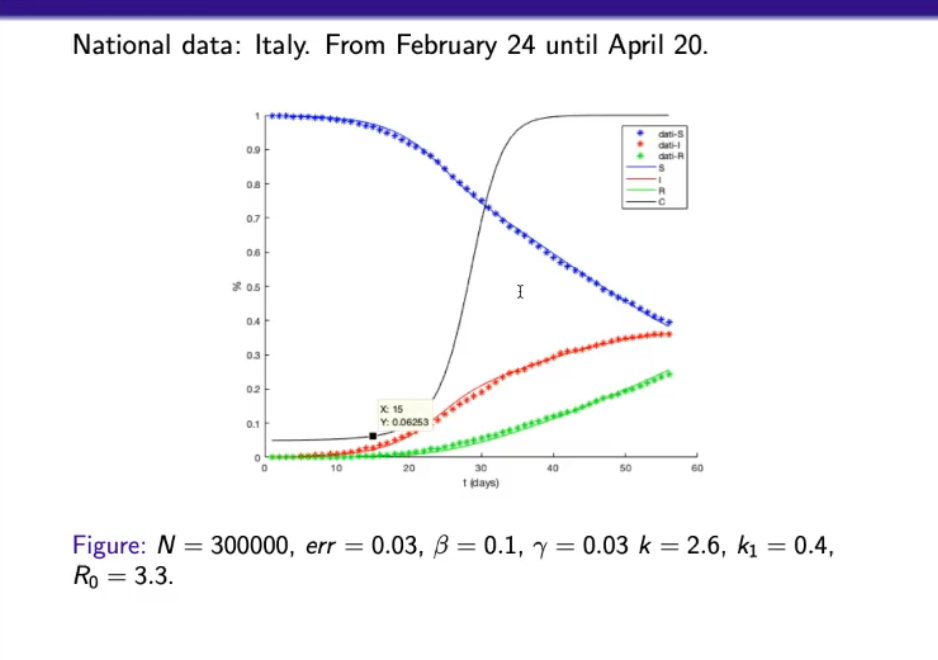
- Since we have more data (all the regions combined), the resulting found function, fits the data a lot better.
- This model accounts also for quarantined individuals and for hospitalized individuals .
- : number of contacts between susceptible and infected.
- : individuals from infected to quarantine
- : infected ⇒ hospitalized
- …
- : hospitalized ⇒ deceased.
- NOTE: That for each equation, the negative part all depend on the respective variable itself, otherwise the variable would become negative in the long run, and in this case each parameter/variable has to be . (we cannot have a negative number of people)
~Ex.: , the negative terms are and they all depend on .