Remember:
We will see more clearerly the definition of bifurcation diagram
If we analyze the stability of all steady states of a sytem, by changing one of its parameters we will obtain a bifurcation diagram, as we have seen in the supercritical hopf bifurcation and subcritical hopf bifurcation, as we changed the parameter .
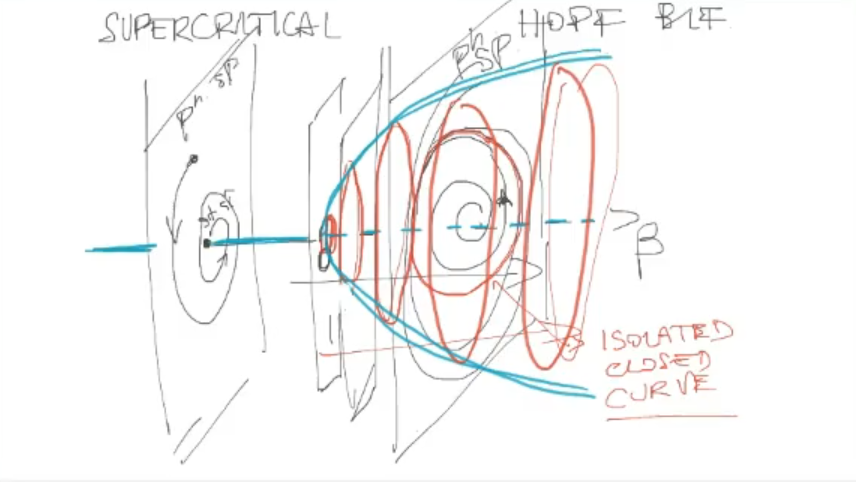
Now let’s try to visualize better the meaning behind the bifurcation diagram:
Each point of the bifurcation diagram represents a phase plane/phase space (with infinite inital conditions), and the lines (dotted and continue) represents the stabilities/attracting set of the phase plane:
Let’s see also the two hopf biffurcation side by side:
- NOTE: since the eigenvalues were the same also the “x-axis” is the same both for the “SUPercritcal” and “SUBcritical”, what chages is the stability of the limit cycle.
- NOTE: this graphs is 2D, it should be 3D!
We may find different cases, for different values, here’s another example:
- However if the limit cycles is stable when the steady state is unstable, it is still considered a supercritical hopf bifurcation.
- And if the limit cycles is unstable when the steady state is stable, it is still considered a subcritical hopf bifurcation.
Now let’s try to visualize better the meaning behind the bifurcation diagram: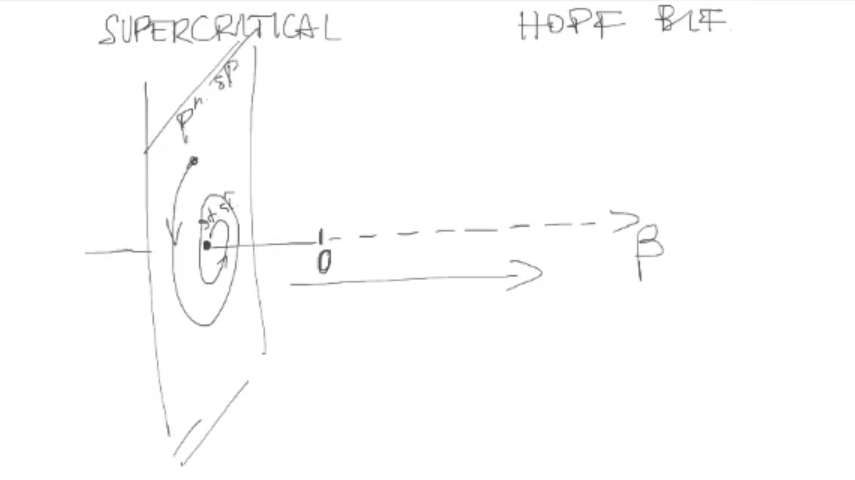 Each point of the bifurcation diagram represents a phase plane/phase space (with infinite inital conditions), and the lines (dotted and continue) represents the stabilities/attracting set of the phase plane:
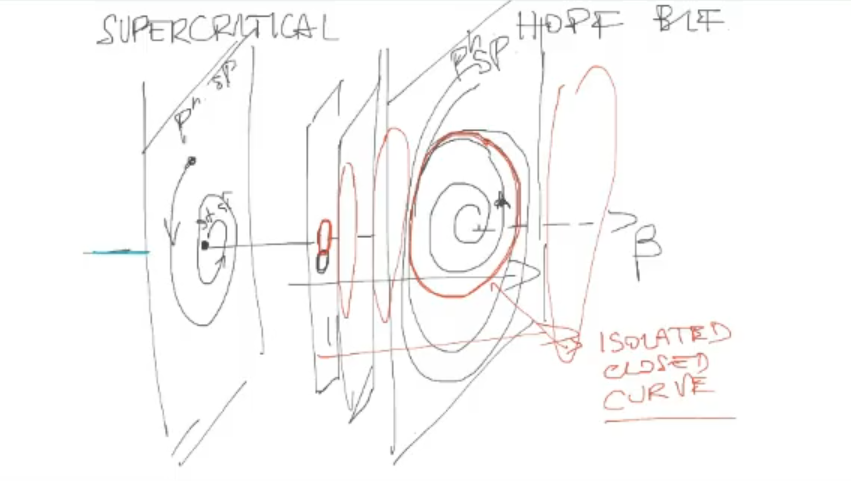
For the subcritical case: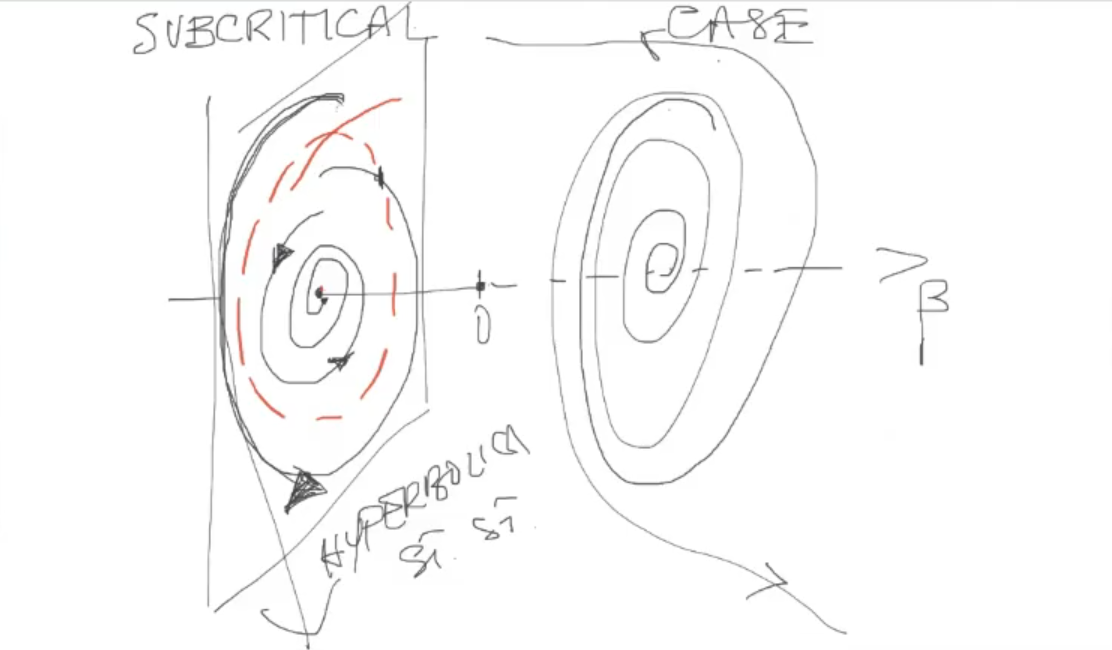
Let’s see also the two hopf biffurcation side by side: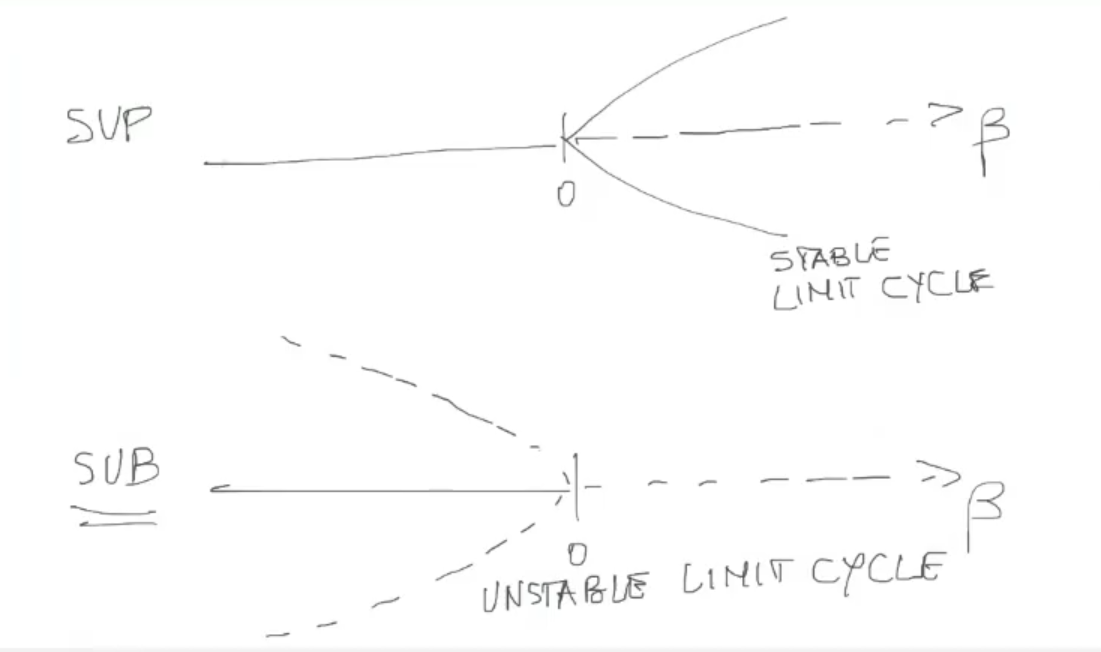
- NOTE: since the eigenvalues were the same also the “x-axis” is the same both for the “SUPercritcal” and “SUBcritical”, what chages is the limit cycle.
- NOTE: this graphs is 2D, it should be 3D!
We may find different cases, for different values, here’s another example: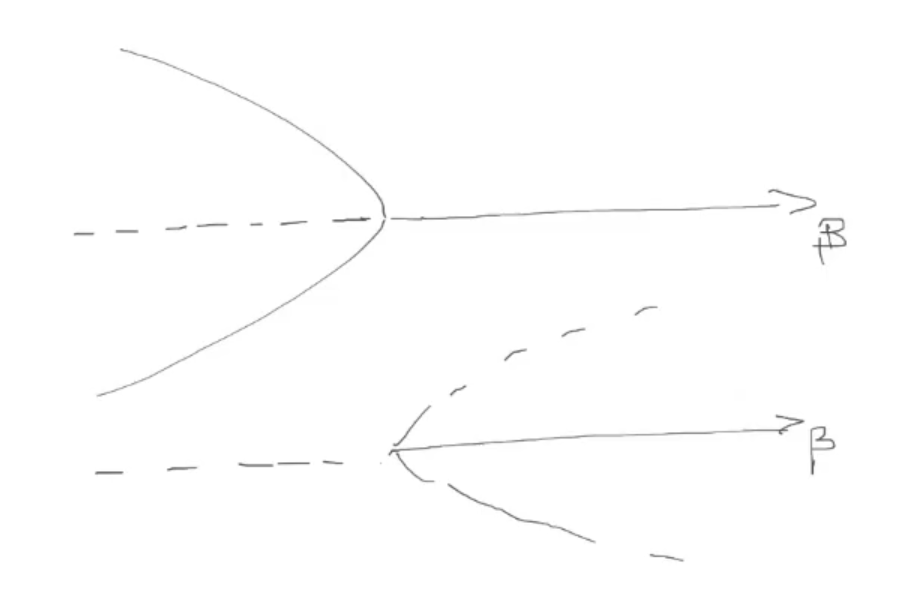
- However if the limit cycles is stable when the ss is unstable, it is still considered a supercritical hopf bifurcation.
- And if the limit cycles is unstable when the ss is stable, it is still considered a subcritical hopf bifurcation.