Recap:
- Video to understand the differences of K-NN, Parzen Window Classifiers and what Kernels are.
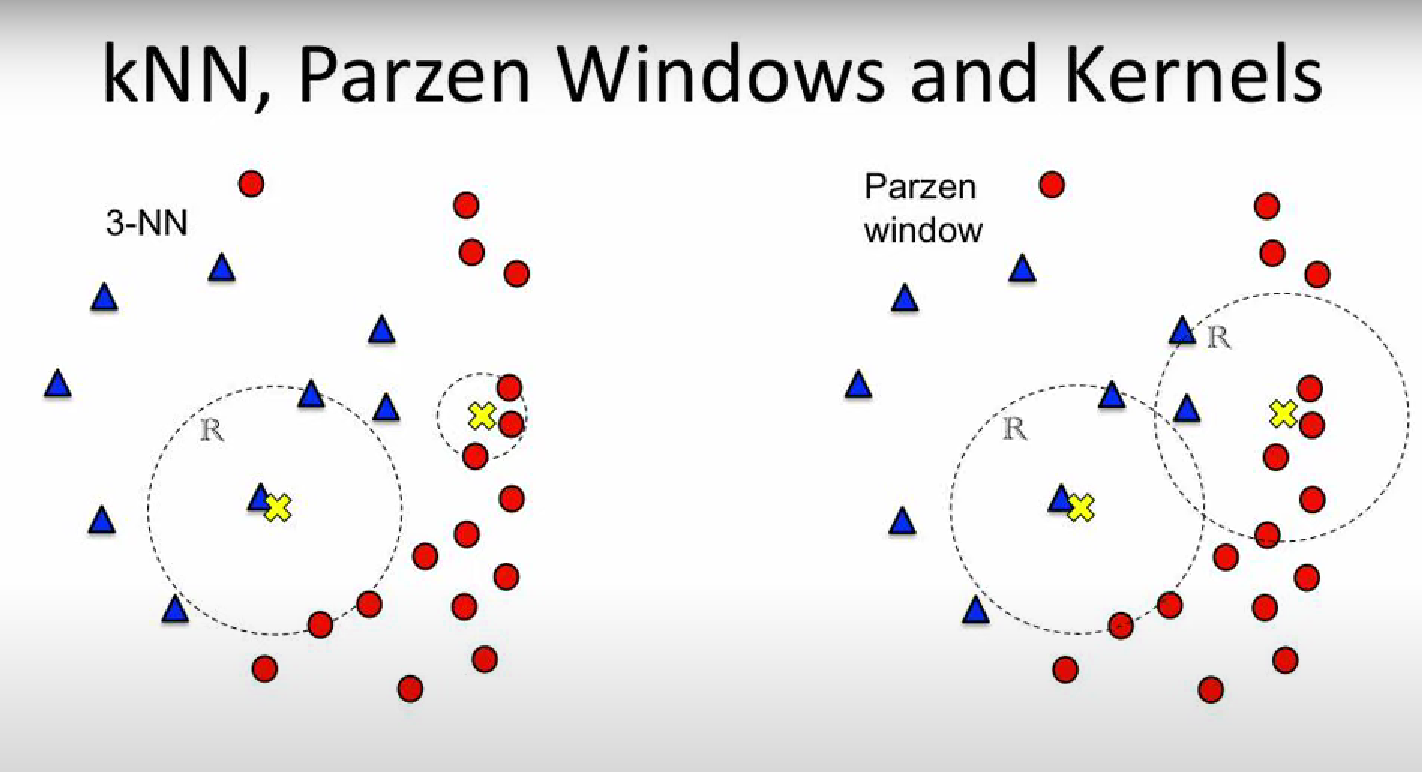
Differences of K-NN and Parzen Window Classifier:
- K-NN (K-Nearest Neighbour) has fixed number of points and we calculate the size of the window In the example both window of the 3-NN have 3 data points inside them, one region is larger the other is smaller.
- Parzen Window: has a fixed window size and we count the number of data points inside the window. In the example both window of the Parzen Window have the same size, one has more data points inside them, the other has less.
NOTE: Both Parzen Window and K-NN are methods for a PROBABILITY CLASSIFIER.
Kernel: As we can see from the next image, it’s unfair to classify based on a “step” function:
We classify this class (the yellow X) as 100% blue, because 2 blue dot are inside it and a red dot is just a little out of the region, so it’s presence is not considered during the classification. ⇒ To solve this problem we introduce the KERNELs
Using the normal K-NN and Parzen Window Classifier we use a step function, saying that if you are inside the region “your vote” counts as , as we can see in this other example:
In this example the class has a of being blue and of being red, not too fair.
Let’s see the difference if we use a Kernel:
This way the closer you are from the center, the more you count, the farther away you are the less you count, but you still count.
NOTE: In practice the Kernel is a function. It usually takes in input the center of the Region and a data point, it gives out the “filtered” weight of that particular data point.
Parzen Window: Before training we can “filter” the data using a function, for example using the hypercube function that selects only the data in a specific region, an hypercube, wide , with dimensions (so its volume will be ). We have defined the “window function” or “kernel” as:
The kernel is a kernel having value only within the hypercube centered in and having edge , the number of data in this hypercube () is:
As we have defined before the estimate of the unknown pdf is , then:
NOTE: We have defined as the hypercube function but this form is equivalent for all window functions.
For example one common choice of a kernel is the Gaussian Kernel:
- : Gaussian pdf.
- : vector of variables, this is a multivariate gaussian distribution
- : mean
- : variance
Sufficient Condition for Asserting that is a PDF :
NOTE: Also, no matter the type of function , we can just take where is an hyperparameter decided arbitrarily, and we can guarantee, as seen in the previous lecture, that the estimated pdf will converge to the actual pdf , as the number of data .
Dirac’s Window Function: Let us define:
Notice how:
- If is big the function is a very smooth function, having small variation and representing a rectangle centered in high and total area equal to .
- if is really small, , than is a Dirac’s Delta centered in .
NOTE: This is a useful example to understand how a different kernel can impact the quality of the estimate .
-Nearest Neighbour : Given that we could have some problems:
- If is too small ⇒ .
- If is too big ⇒ .
We can solve this problem generalizing the value of , first we want to assert that:
A possible solution to this problem is taking , such that:
Now instead of deciding the Volume we create it this way:
- Chose our center
- Create an hypersphere of dimension around
- Let the sphere expand until it includes data.
- Calculate the volume of this hypersphere.
To have more flexibility we can define where is an hyperparameter decided arbitrarily.
Naming :
- : mean and vector mean
- : variance and covariance matrix
- : parameter vector, for example:
- : classes, for example the gender (male/female) we want to identificate.
- : weight
- : bias
- : data, could mean data in input or training data.
- : is our pattern of interest, for example an input data we want to estimate after training the model
- : is the real probability we are searching.
- : -estimate of the pdf where is the number of data used to calculate this estimate.
- a set of data, it usually used to indicate the training set. We could find where refers to the data of a single class , and it is given according to the distribution .
- : set of data belonging to the test set .
- : set of data belonging to the validation set.
- : number of samples used as the training set
- : real probability that , the data or variable we want to classify belongs to/is identified as the class (~ex.: in reality the percentage of male and female is ).
- : estimated probability of (~ex.: we estimate that the the percentage of male and female is , tho this is not actually true).
- : discriminant function of class , usually it is defined as: (in the linear case)
- : decision rule, a simple decision rule could be:
Link to original